
In this article, we will address a very interesting solution for reducing losses caused by shading of photovoltaic modules.
If you have read my previous articles you will already know that partial shadows are a great danger for photovoltaic systems. Few people know this.
Most photovoltaic system designers are unaware of (or ignore) the problem of partial shadows. And most of the consumer market is unaware of the differences between inverters.
When there are no shadows – a rare situation in residential photovoltaic systems – everything works well and it is difficult to notice the differences between inverters from different manufacturers, but not all inverters are capable of providing maximum energy generation in shady situations. This is a very delicate subject that I intend to explain in detail below.
IV curve of photovoltaic modules and arrays
Let's remember a little about the characteristic curves of photovoltaic modules.
Photovoltaic modules have an electrical behavior that is described by their current and voltage curve (IV). The product of voltage and current gives rise to the power and voltage (PV) curve.
Read too: Understanding the IV and PV curves of photovoltaic modules
Understanding the effect of partial shadows on photovoltaic systems
If you have a module, a string (modules connected in series) or an arrangement (several strings connected in parallel), there will always be equivalent IV and PV curves, as shown in the illustrations below.


The IV and PV curves of the modules, strings or photovoltaic arrays would always have the same format if the modules of an installation were always subject to the same light intensity. We know this is not always true.
In solar plants this can happen, but in rooftop installations, especially in urban regions, the situation is very different. Single string or a single shaded module can knock out the power generation of an entire system.

In Figure 2 we see what happens when just a few modules of a string receive shade. This is what we call partial shading.
The same situation can be found in systems with several strings in parallel, even if only one of the strings has a small part of the modules shaded.
The problem highlighted in Figure 2 is the presence of several points of maximum power in the IV and PV curves, a phenomenon that occurs in situations of partial shading of the photovoltaic modules of a system.
In the IV curve, the point of maximum power is located at the knee of the curve, while in the PV curve, the point of maximum power is located at the peak of the graph.
But what is the problem caused by the presence of multiple maximum power points? To understand this, it is necessary to understand how the photovoltaic inverter works.
There is a control system in every photovoltaic inverter called MPPT (maximum power point tracker – maximum power point tracker).
What does MPPT do?
When we connect a set of modules to the inverter input, respecting the characteristics of the equipment, it does not know how many or which modules are connected.
The inverter has no knowledge of the module model, power, number of connected modules and series. The only thing the inverter knows is that it must extract energy from the modules and convert it into alternating current.
The photovoltaic module has an optimal operating point that is its maximum power point, located at the knee of the IV curve or at the peak of the PV curve. One of the functions of the photovoltaic inverter is to adjust the operating point of the modules, making them operate as close as possible to their maximum power point.
Since the inverter does not know the characteristics of the modules that are connected to it, there must be some way of tracking the maximum power point. This is the function of the MPPT system found in all solar inverters. grid tie, used in photovoltaic systems connected to the electrical grid.
The MPPT system allows searching for the maximum power point of the photovoltaic module (or set of modules) through small disturbances. The inverter increases the operating voltage of the modules a little and observes what happened.
If the power has increased, it continues to increase even more. If the power decreased in the first disturbance, then the algorithm instructs the inverter to move in the opposite direction, decreasing the voltage to observe whether the power will increase or decrease.
This simple method, called disturbance and observation, equips almost all solar inverters grid tie. The idea of the algorithm is to cause slight disturbances in the voltage of the modules and observe what happens as a result. This way, the inverter tracks the IV and PV curves in search of the maximum power point.


The perturbation and observation algorithm works very well when all modules have the same light intensity. In this case, the inverter will be able to find the maximum point or peak of the PV curve.
However, in situations of partial shading, most inverters will not be able to find the maximum power point of the system due to the fact that there are several maximums, as illustrated in Figure 4.
In this example, there is a global maximum (which would be the system's optimal operating point) and a low-power local maximum.
In cases like the one illustrated in Figure 4, which occur in situations of partial shading, the MPPT mechanism will almost always be stuck at some point of local maximum, being unable to see the existence of the global maximum.
What does this mean in practice? Translated into simple language: you can have a 10 kW system that will only deliver 300 W because of a single shaded module.
There must be a way to protect ourselves from partial shadows, which are a very common situation in photovoltaic systems. What can we do?

There are several strategies, which include separating modules into smaller sets, adopting microinverter technologies and optimizers or the use of inverters with algorithms smart or dynamic MPPT.
What is dynamic MPPT?
Dynamic MPPT is the generic name given to a set of strategies that can be used to improve the performance of traditional MPPT algorithms.
There are several techniques in the literature for performing dynamic MPPT and a few inverter manufacturers employ these methods in their equipment.
The dynamic name suggests that the algorithm does not have static and repetitive operation. Contrary to traditional algorithms, dynamic MPPT changes its operating mode over time, which allows tracking of maximum global power in situations of partial shading, when the photovoltaic system has one or more local maxima or peaks.
Dynamic MPPT has its drawbacks, so it should be used with some moderation. A very dynamic algorithm (very fast) can cause disturbances in the operation of the inverter, which can lead to the opposite effect of reducing efficiency. An algorithm that is too slow can be ineffective, almost as bad as a traditional MPPT.
The world's leading inverter manufacturers, who invest a lot of effort in research and development, are able to offer the market inverters with sufficiently good (and moderately fast) dynamic MPPT algorithms, capable of facing some very complex shading situations, which would simply be ignored by inverters. conventional.
It is not the purpose of this article to enter into a deep discussion about the functioning and theory involved in dynamic MPPT algorithms. But let's at least try to understand a little of what we're talking about.
The central idea of any MPPT algorithm is to cause disturbances in the voltage of the photovoltaic modules, seeking to observe what happens to the power of the modules (whether it decreases or increases) after each disturbance.
Based on the result of the disturbances (increase or decrease in power) the algorithm can know whether it is disturbing in the right or wrong direction. This disturbance and observation procedure was illustrated in Figures 3 and 4.
The main idea of dynamic algorithms is to perform, from time to time, some perturbations that are slightly larger than normal. Then, the inverter slowly increases the size of the disturbances and checks what happens.
With this, the MPPT algorithm is able to realize that it was stuck at a local maximum when at some point it observes that the power increased when in fact it should have decreased.
At this point, the algorithm abandons the local maximum (which it was initially stuck at) and sets out in search of its maximum objective: the maximum or global peak of the PV curve of the photovoltaic system, the operating point at which the energy generation of the photovoltaic system will be maximized.

Test results
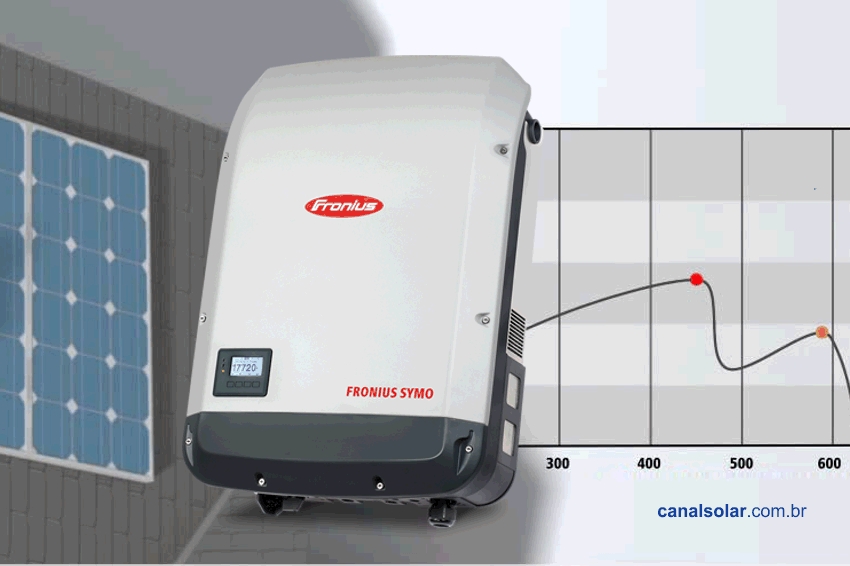
We tested a Fronius Symo inverter in LESF (Energy and Photovoltaic Systems Laboratory) at UNICAMP. The inverter was connected to an electrical grid simulator, as equipment is not normally connected directly to the electrical grid in laboratories.
In this case, we could have even used the electrical grid directly, as our interest was only in testing the MPPT system. The electrical network simulator is useful when we want to carry out tests on the AC (alternating current) side of the inverter, producing electrical network disturbances (variations in frequency, voltage, harmonic distortion) to verify the behavior of the inverter in different power quality scenarios. electricity.
The most important equipment (after the inverter) in the tests we carry out is the photovoltaic module simulator. We use Terra SAS equipment (solar array simulator) from Ametek, one of the most powerful equipment on the market.
This equipment is capable of faithfully reproducing the behavior of a set of photovoltaic modules. This makes it possible for us to test a solar inverter without having a solar plant on the roof.
It would be really cool to have a solar plant at our disposal to carry out tests, but a real photovoltaic system would not allow us to carry out specific tests, nor to reproduce the same tests over and over again.
If the objective is to test inverters, the best resource we can have at our disposal is a photovoltaic panel simulator like the one shown in the photo below.


We configure our SAS (solar array simulator) to reproduce some situations of strings photovoltaics evenly and partially shaded. The IV and PV curves of these strings are shown below. The figures we see below are photos of the software control system of the SAS simulator.

We tested the Fronius Symo inverter with DPM in two different cases. The first case, illustrated in Figure 9, presents a PV curve with three peaks. In this case, we observed that the result was very good.
Firstly, the inverter tracked peak 1. This is because the inverter always starts tracking the PV curve from the maximum voltage (voltage and open circuit). Any inverter we were testing would be able to find peak 1.
A conventional inverter (without the DPM) would remain forever stuck at peak 1, without seeing the existence of peak 2, with greater power. After a few moments at peak 1, with a power of 3.2 kW, the Fronius Symo inverter was able to escape this situation and locate peak 2, with a power of 6.8 kW.
See how great the loss of this photovoltaic system would be with a conventional inverter: the operating power practically doubled with the presence of the dynamic peak manager.

In the second case, illustrated in Figure 10, we pose an even greater challenge to the inverter: a PV curve with three peaks. Once again the Fronius Symo inverter did very well, being able to locate peaks 1, 2 and 3 sequentially.
The yellow arrows in Figures 9 and 10 show the instantaneous operating points of the photovoltaic system. The photos were taken at different times, showing situations that occurred before and after. It is interesting to see the operation of the dynamic peak manager.

Conclusions
Photovoltaic systems run the risk of operating at low power values in partial shading situations, when the inverter's MPPT is not capable of detecting the existence of local power peaks.
Only inverters equipped with dynamic MPPT algorithms have the ability to provide maximum efficiency of the photovoltaic system during the occurrence of partial shadows, when only a part of the modules of a string or of an arrangement is struck by shadows.


2 Responses
Great!
I'm preparing my TCC and I hadn't read any scientific articles yet and I also didn't know about the existence of equipment that performs the dynamic search for the MPPT. Thank you very much for the great information!
Very good article, congratulations. Would you be able to report the behavior to other inverter manufacturers?