
Authored by Rodolfo Barreto, Amara NZero Photovoltaic Project Assistant with collaboration by Thiago Mingareli, Amara NZero Technical Manager
In recent months, much has been said about the reverse flow due to rejections mainly from CEMIG/MG, but which has already spread to other energy concessionaires across Brazil.
This fact generated dissatisfaction and apprehension in requests for access opinions by photovoltaic sector integrators, with the distributors' main justification being that the electrical grid is unable to receive energy injected by new photovoltaic systems (flow reversal).
In its justifications, the concessionaire is based on the normative resolution Art. 73 of REN 1000. In its provisions, it says that:
- 1st If the new connection or increase in injected power from microgeneration or distributed minigeneration involves inverting the power flow at the distributor's transformation station or in the feeder circuit breaker, the distributor must carry out studies to identify viable options that eliminate such inversion…”
If refusal is necessary, the concessionaire must comply with the requirements of Article 73 of REN 1000.
Therefore, in this article we will show the technical point of view where reverse flow can ACTUALLY occur, far from what energy utilities have applied, attesting reverse flow without plausible justifications or criteria.
What can you do to avoid rejecting your opinion, and also avoid or mitigate the reverse flow? In this article, you will understand what flow reversal is, how it works in practice and what can be done in these situations.
What is reverse flow, and what are its impacts?
This phenomenon has become increasingly common in the current scenario of distributed generation, with greater emphasis on photovoltaic systems.
Its effect occurs due to the high insertion of active power in the transmission line (at times when a greater peak of irradiation/energy generation is observed in PV systems), which are, coincidentally, the periods of low consumption demand nowadays. – interval between 10 am and 4 pm, more or less.
This behavior has had some impacts on the topology of the distribution network, affecting its energy quality standards.
Among the impacts observed daily in photovoltaic systems, the one that stands out most is voltage fluctuation, however there are some other interferences that can occur, such as: changes in power factor, frequency regulation and harmonic distortions.
What can be done to mitigate these effects and avoid reverse flow?
One of the possible factors for mitigating this effect, with the aim of prevention, would be the use of software by concessionaires with the aim of verifying the impacts they can cause on their infrastructure, using components already present in their network and gradually inserting distributed generation. on your connecting extensions.
Because what we have seen, in practice, are concessionaires claiming flow reversal but without carrying out in-depth studies and mainly PROPOSING ALTERNATIVE SOLUTIONS for the connection, as required by the normative resolution.
Currently, this is already possible and visible in some free code software, an example of this would be OpenDss, with several networks available, simulating large or small distribution branches, making it possible to insert and compensate distributed generation.

In these simulations it is possible to notice different behaviors in the voltage level depending on the location where the distributed generation connection is defined.
Another possible solution would be to control the active power injection of photovoltaic inverters, making compensation by adjusting their power factor, or using storage systems at these times, making compensation at a later time, with greater consumption.
A final option is the use of zero-grid systems, without injecting energy into the grid, meeting the site's internal consumption.
See in practice how the voltage profile varies when there is a high injection of active power into the network.
For verification purposes, a simulation was carried out in the OpenDss software considering the IEEE 13-bus test network. Even though it is a small system, the IEEE 13 bus network presents diverse configurations that allow the most varied analyzes of a distribution system and its components.
This circuit operates at a voltage of 4.16KV and consists of sections of unbalanced three-phase overhead and underground lines, two-phase and single-phase branches, two banks of shunt capacitors, a voltage regulator in the substation, two distribution transformers and unbalanced loads.
Loads with a residential and commercial profile are connected to the bars located after the secondary of the step-down transformer (4,160/220V) as can be seen in Table 1.
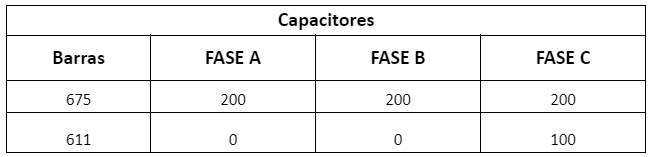
The nominal powers of the capacitor banks, as well as their connection bars, are presented in Table 2. The complete single-line diagram of the distribution system can be seen in Figure 1.
Table 1 – Loads connected to the IEEE 13 Bus network
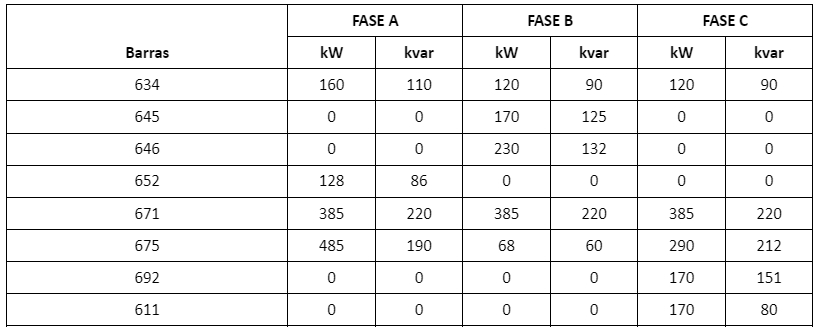
Table 2 – Capacitor bank connected to the IEEE 13 Node Test Feeder network

In the following analysis, graphs are presented showing the behavior of voltage in the network without the insertion of distributed generation and with the insertion of 180% for the injection of active power from distributed generation, considering the consumption of the loads.
It is possible to observe and analyze, from the exposed graphs, the voltage profile and active power consumption throughout the day in each bus of the simulated distribution system. To this end, an acceptable limit on the variation of the nominal voltage of 5%, as recommended in module 8 of the distribution procedures – PRODIST.
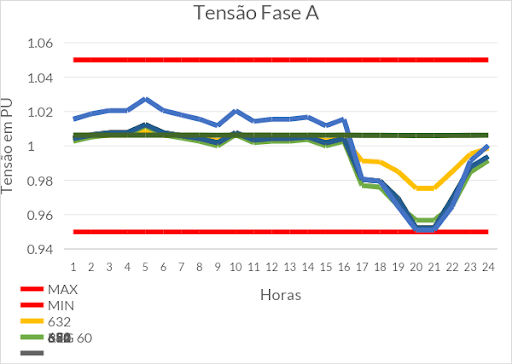
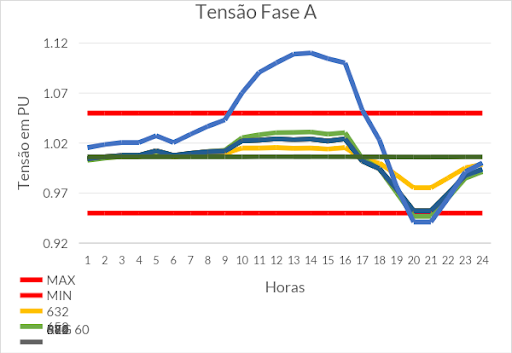
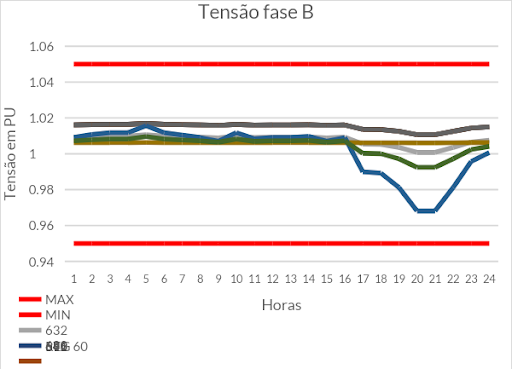
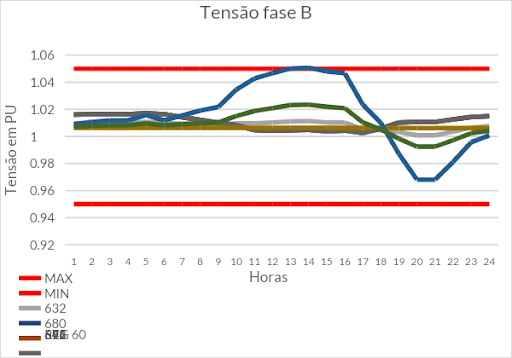
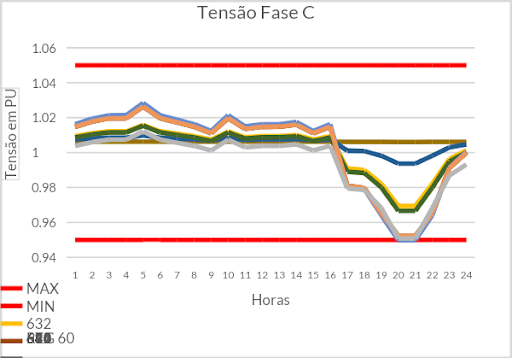
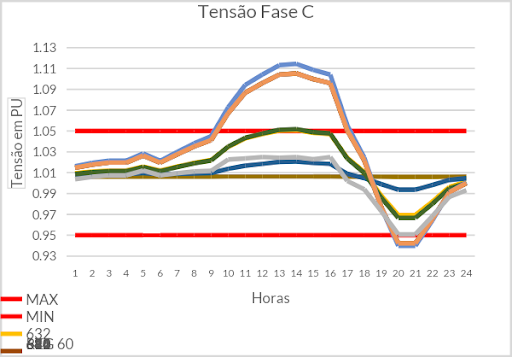
An important point to note is the variation in the voltage profile when there is an injection of active power between the hours of 10 am and 4 pm in the connection bars, in some of them in a pronounced way.
Why does it happen?
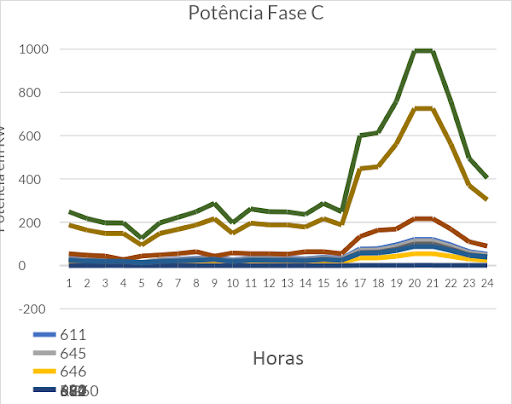
Such behavior can be justified due to its greater distance in relation to the transformer that feeds the distribution network, an example of this is bar 611 shown in the phase C voltage graph, analyzing the single-line diagram, we can see that it is in a position further away from the regulator, causing it to have a greater impedance, and at the time of high insertion of distributed generation, it shows an increase in voltage.
At the end of the day, it is possible to notice a drop in the voltage profile from 5pm onwards, in accordance with the typical residential consumption curve adopted which considers a greater overload on network demand between the hours of 5pm and 9pm, behavior that causes a significant voltage drop on the connection bars.
When is it possible to visualize the flow reversal?
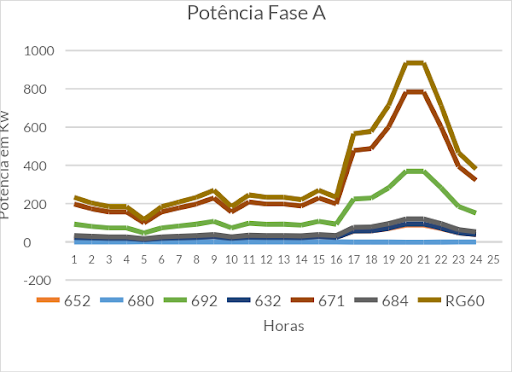
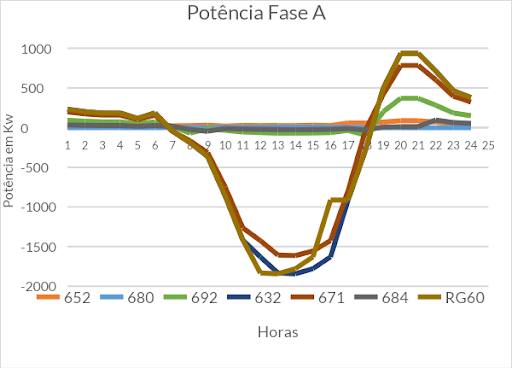
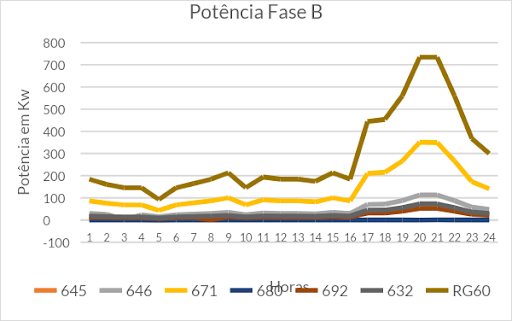
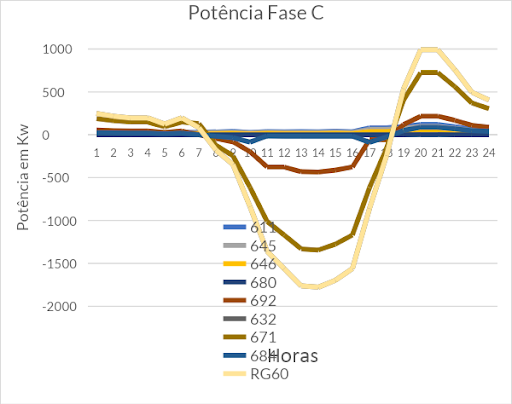
Next, graphs were plotted where we can see the behavior of power in situations without distributed generation and with the insertion of distributed generation, with the behavior of the reverse flow being visible.

-

Figure 12: Power Chart for phase C without distributed generation Figure 13: Phase C power graph with distributed generation 180%. Source: Author In the comparative graphs of active power injection, the behavior of the reverse flow is evident at times when there is a greater injection of active power into the distribution network, clearly seeing the difference in the graphs with and without distributed generation, reflected in the power curves of phases A, B and C, from 9am to 4pm, showing what is currently happening in some sections of the network.
This effect is one of the main causes of disturbances that occur in photovoltaic systems, the most common being overvoltage.
Conclusion
The objective of the article was to technically show in which situations the reverse flow can actually occur, even to help support our partners in disputes to be made with the energy concessionaire in situations that allege inadequately or without due justification the reasons for point out flow reversal and deny access opinion.
We strongly disagree with the arbitrary way in which this has been applied by energy concessionaires, and it is our duty to counter-argue and demand that they demonstrate where (and if) this occurs, based on a detailed technical study.
As alternative solutions to avoid reverse flow and consequently overvoltage in already installed photovoltaic systems, we have the adjustment of the inverter's voltage parameters (always highlighting that it is necessary to follow all the new laws in force), avoiding equipment activation due to overvoltage.
This intervention is just a palliative to minimize the impacts caused by the strong insertion in the connection of photovoltaic DG to the distribution network, however, another viable alternative would be the regulation of the power factor of the inverters using the DG itself to correct the voltage profile. through the injection of reactants, as well as a battery bank to store the excess energy produced, and the use of electric chargers, with the loading and unloading of vehicles, which can be used as a device in the excessive supply of active power in the network.
Unfortunately, this fact has been recurring in the daily lives of our integrator partners, and we advise you to resolve the problem by opening complaints with the concessionaire or, as a last resort, in situations where access opinions are rejected, contact the National Energy Agency's ombudsman. Electricity or even seek solutions through legal means because as we can see in the article, there is the possibility of reverse flow situations occurring, however it is the concessionaire's obligation to carry out studies and propose alternatives for the customer's connection – and not simply refuse the request.
Bibliographic references
[1] NATIONAL ELECTRIC ENERGY AGENCY. Electrical Energy Distribution Procedures – PRODIST. Module 8 – Electrical Energy Quality. 2021.
[2] ANEEL. National Electric Energy Agency. Normative Resolution No. 482, of April 17, 2012.
[3] BATISTA, Rodolfo Barreto. Analysis of the Impacts Caused by the Increase in Photovoltaic Systems Connected to the Distribution Network.2023.


One Response
Electric current always flows from source to load. If, for various reasons, there is a reverse flow at the transformation station, doesn't it mean that the demand after this station is greater than before it? In other words, in any case this energy is being used at some point in the system (mostly interconnected in a ring).
Another question is how to claim that a particular solar generator is responsible for this inversion? Couldn't it be from another source, even generation from Cemig's own plants?
What we see today are unfounded allegations that, as always, harm consumers. At the very least, a transfer of responsibility from those who hold the obligation (concession) and operation of electrification services to their end customers, with the option of choosing that provider not being possible.
Regulatory bodies turn a blind eye and nothing is being resolved.
It is very common to observe, since before the distributed generation bull, locations with voltage levels of 250 Vac phase-to-phase. In fact it should be 220 Vac. This in itself demonstrates that our electrical system has been in need of improvements for a long time. Cemig has been doing this for a long time so as not to retrain the networks and there was no problem. However, in those same locations, if a customer wants to insert a solar generator, the opinion will come with such a flow reversal.