

When analyzing the historical prices of photovoltaic systems, we noticed a downward trend, linked to the maturation of professionals in the market, greater competition and the accelerated advancement of technology worldwide. Even with fluctuations in the dollar, the photovoltaic market has been moving towards a reduction in the average value of installations over the years.
Knowing about this annual price reduction, some customers may resist closing deals in the hope that the system price reduction for the coming years will compensate for the “delay” of not installing a system today. In order to be able to financially analyze the best investment and compare their performance over time, this article will carry out a study with historical data on average system prices.
Considerations
For this simulation, a residential system in Campinas will be considered, with 4 kWp of installed power and a generation capacity of 6500 kWh annually.
We will use the energy tariff in 2020 as a reference in the study (R$ 0.65 / kWh) and consider an annual inflation of 5%. The degradation of the system's generation affects its economic performance and, to model it, we will assume a degradation rate (reduction in the power of the photovoltaic modules) of 0.9% per year
Finally, a discount rate will be considered (i.e., a reference rate of return on financial investments) according to the SELIC history for the moment and according to the SELIC forecast according to the bulletin Central Bank Focus.
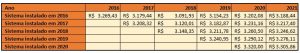
Five implementations of the same system will be compared, varying the installation date between them (from 2016 to 2020), using the average price of systems published in the quarterly surveys of the Greener and the generation conditions described in the previous paragraph. The installation costs considered for the systems are described in the table below.

Financial Analysis Tools
As we are dealing with the time variable in financial analysis, we need to have tools that allow us to compare the real value of money over the years. In short, one hundred reais saved in 2016 is worth more than one hundred reais in 2020, both due to the inflation factor and the opportunity cost of having the money parked.
The instrument we use to analyze the viability of investments in this condition is the NPV (Net Present Value). The NPV uses a reference rate (in our case: 5%) to adjust future values by the equivalent present value of that launch.
In other words, a saving of one thousand reais on the energy bill in 2016 has a greater value than a saving of one thousand reais in 2017. For example, to have an idea of profitability over time, the NPV will apply a discount rate to the savings of one thousand reais in 2017, adjusting it to how much that amount represents in 2016 (for the reference rate at 5%, the value of one thousand reais of savings in 2017 has the same financial value as R$ 950.00 had in 2016).
For an investment to be profitable, its NPV must be positive and, in general, we want the NPV to be as high as possible.

Thinking precisely about the discount of money over time, we can put together a nominal cash flow study and a discounted cash flow. The first shows the inflows and outflows of money with their nominal value. The second flow (discounted) reflects the discount of money over time for each entry and exit. An example of discounted cash flow can be found in Figure 2. The NPV is nothing more than the sum of the discounted cash flow values.

Another figure that we can use when comparing systems is the IRR (Internal Rate of Return). The IRR is defined as the discount rate that makes the NPV equal to zero. In practice, this means that, if the customer invested the money from the system in a competing application that yielded the value of the IRR or more, the NPV would be negative and the investment in the solar system would not make sense.
In other words, we want the IRR to be higher than any competing investment that the client chooses to make. The payback time can also be used in this comparison, however it does not consider the discount of money over time, and will be shown in this analysis for illustrative purposes only.
Results
Using energy generation estimates with PVSyst or Solergo and spreadsheet software, such as Excel, it is possible to calculate the NPV, IRR and payback time of the photovoltaic system. In this study, we are assuming that a customer had the option to install a system in 2016, 2017, 2018, 2019, or 2020.
In other words, we want to investigate which system installation date would be the most profitable. For a system that had its installation postponed until 2017, for example, the year 2016 will have zero cash flow. Nominal cash flow of savings for the first six years of the analysis.

![]() Discounted cash flow for the first six years of the analysis.
Discounted cash flow for the first six years of the analysis.
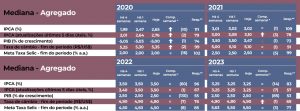
In the previous table, the discount rate carried out between 2016 and 2020 reflected the historical value of the SELIC at the time, therefore, it varied each period. As of 2021, the discount rate considered was that predicted by the Central Bank's Focus bulletin. From 2024 onwards, the rate considered was equal to the rate for 2023.
 With the simulated cash flow for all systems between 2016 and 2045 (and with information on the value of investments) it was possible to arrive at the values summarized in the table and figure below.

We have to be especially careful when drawing conclusions from these numbers. Starting with the NPV, we noticed that its value improved between 2016 and 2017 – this was due to the very rapid drop in prices at that time. However, between 2017 and 2020 the NPV decreased.
In other words, between 2016 and 2017, for all the assumptions presented above, the financial return of waiting for prices to fall made sense. From 2018 onwards, the situation is reversed, making it no longer worth postponing the project. We note here that the IRR and payback time information do not allow a clear conclusion about the investment, as both do not well represent the difference in the results of investments made at different times.
What to expect from future prices?
To answer once and for all the question about whether or not it is worth postponing investments in solar energy systems (waiting for a possible drop in prices), we must be concerned with the future price projection of photovoltaic systems.
As Brazil imports a very large percentage of modules and other components, system prices here depend heavily on the value of the dollar, international shipping and the global market situation. The graph below was taken from a strategic study by IRENA (International Renewable Energy Agency). The report concluded that the decrease in the cost of systems worldwide between 2020 and 2025 should be around 4.2% annually.

To predict the impact of postponing investments from 2020 onwards, we will assume that in Brazil this trend of annual decline of 4.2% in system costs will apply, as shown in the table below.
 Redoing the NPV analysis with the expected costs for the systems in 2021 and 2022, we arrived at the following results.
 The data in the table above shows us that given the drop in prices for photovoltaic systems expected for the coming years, it does not make financial sense to postpone the installation of a system.
Conclusion
This article showed, based on an analysis based on NPV and some economic assumptions, that in the current market situation it is not worth postponing investments in photovoltaic solar energy systems. At the beginning of photovoltaic technology, postponing investments was a question that arose and remained ingrained in the minds of customers and investors.
In fact, many years ago, prices for installed systems dropped sharply from one year to the next. Choosing to install it this year or wait for the following year was a question that could even make some sense. Despite fluctuations in the dollar exchange rate in Brazil and fluctuations in the international market, the expected drops in the prices of photovoltaic systems are small and show that the global market is already quite mature, with relatively stabilized prices.
Currently, waiting for price drops to opt for the future purchase of a photovoltaic system is not a good option. In the studies presented, inflation and capital remuneration rates of 5% were used.
In practice, it is known that electricity tariff inflation has already been and could be higher, while in the financial market there is a general trend towards reducing interest rates, with many investments currently showing negative real interest rates. This makes it even easier to state that the installation of photovoltaic systems is advantageous and should not be postponed.
new RDStationForms('interesse-em-cursos-articles-do-canal-solar-2a68fc32cce5530fe808', 'UA-145443047-1').createForm();


One Response
Good morning, should we wait a few more months to install the plant at home or not?