
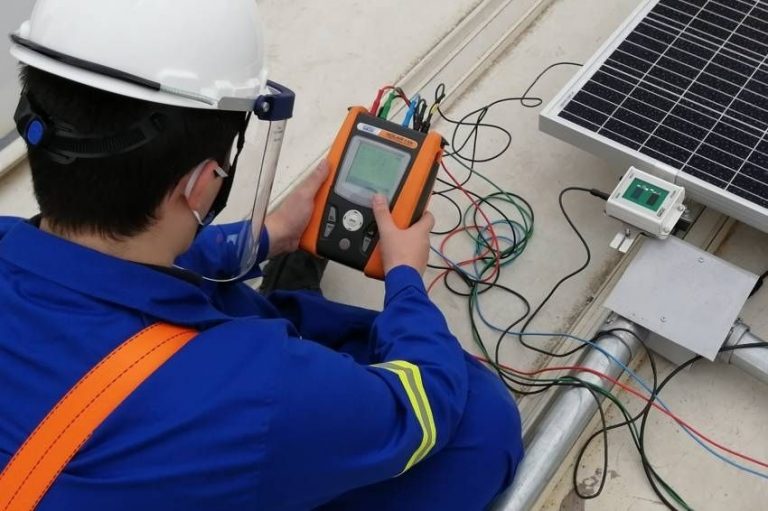
This article aims to present the functionalities of the IV curve tracer, a device used in the analysis and diagnosis of photovoltaic modules and strings.
We will also demonstrate the importance of this instrument for the success of a photovoltaic project through a case study.
A curve IV is the electrical curve that relates the voltage and current at the output of a module or set of photovoltaic modules. Analysis of this curve allows us to know whether the modules are working properly or whether they have problems.
The IV curve tracer is also capable of measuring voltage and current in photovoltaic systems, informing the user of the values of short-circuit current, open circuit voltage and maximum power of the module or set of modules analyzed.
With this equipment, combined with temperature and irradiance sensors, it is possible to measure the main electrical parameters of a photovoltaic module or string in two different parameterizations, in OPC (operation conditions, that is, the ambient operating conditions of the tailored element ) and also in STC (standard test conditions, i.e., irradiance of 1000 W/m2 and operating temperature of 25 ºC).
To present measurement results in STC, the equipment normalizes the current, voltage and power values measured under operating conditions. This means that the current and voltage values obtained experimentally are corrected based on the irradiance and temperature values recorded at the time the electrical measurements are carried out.
The scope of usefulness of this equipment is aimed at commissioning activities for photovoltaic plants and systems. The tracer has the function of carrying out the performance test of photovoltaic modules.
According to the ABNT NBR 16274:2014 standard, the tracer test is only necessary in “more complex systems”, as curve IV is complementary information in the global diagnosis of a set of photovoltaic modules.
The IV curve design is often discarded by integrators, either due to the high cost of acquiring the equipment or simply because a more detailed evaluation of the system is neglected.
Faced with so many problems and failures found in photovoltaic installations, the IV curve ends up being considered by many people as precious, mainly because it is an optional item of the NBR 16274 standard. In other words, there would be other more important tests to be carried out beforehand.
However, this is precisely where the greatest need to obtain the IV curve of the strings in photovoltaic systems is justified: obtaining the IV curve, in addition to drawing the curve itself, offers a rich set of information about the health status of the strings. : short circuit current, open circuit voltage and peak power. The use of the curve tracer in the commissioning of photovoltaic systems would avoid many of the problems encountered in installations.
The IV curve can reveal not only failures in the installation of the photovoltaic system, but also defects in the photovoltaic modules. Although photovoltaic modules have compulsory certification from INMETRO in Brazil, the quality of the equipment may change from the moment it leaves the factory.
Whether during transport from the factory, from the transfer from the distributor to the installation or during the lifting of the modules to the roofs, photovoltaic modules are subject to mechanical impacts that can cause irreversible damage, such as microcracks and damage to the junction boxes, compromising generation at the same time. over the years.
Furthermore, modules, like any other manufacture, are subject to factory defects, such as possible failures in the bypass diodes that contribute significantly to the drop in energy yield.
There is still the fact that many unprepared installers step on and lean on the modules during installation, which causes the photovoltaic cells to break. Defects in the cells are imperceptible through visual inspection, but can be detected by the IV curve tracer.
Analyzing this set of facts, combined with the fact that an installation generating less than expected can generate great customer dissatisfaction, it seems reasonable to spend time and investment to protect against possible wear and tear. If you believe that a conventional multimeter is sufficient to meet this need, perhaps you are correct.
However, if you have already measured the open circuit voltage of a string and wondered if that value, although lower than expected, made sense, perhaps it is time to expand your horizons and resolve your doubts with quality measuring equipment.
About the IV curve test
For an overview of how to work with an IV curve tracer, a brief step-by-step guide will be shown to carry out an appropriate photovoltaic performance test, using generic equipment available on the market, the brand of which will not be disclosed due to the educational nature of this article, without the intention of promoting any specific manufacturer.

Before any initiative to use the IV curve tracer, it is necessary to evaluate the weather conditions of the day planned for the activities. According to the standard, there is a prerequisite that measurements must take place under clear sky conditions, in addition to presenting a minimum irradiance of 700 W/m², measured on the same plane as the modules.
Finally, the current and voltage parameters of the measured array must be consistent with the limitations of the measuring apparatus – after all, we do not want to damage our curve tracer. Respecting the climatic conditions stipulated by the standard and the measurement limits being compatible with the element under test, we can now worry about the procedures that must be carried out for the test.
Initially, it is necessary to stop generation by opening the inverter disconnector switch or the stringbox. This will prevent the occurrence of electrical arcs and fires, allowing tests to be carried out safely. Photovoltaic circuits must never be disconnected under load without using the disconnector switch.
In other words, we cannot open a connector or a fuse box while there is electrical current flowing through the system. Circuit interruption can only be carried out safely using the disconnector switch, a mandatory item in DC circuits according to the ABNT NBR 16690 standard (except in installations with microinverters).
Then it is necessary to install the auxiliary sensors in the test location. The IV curve tracer generally has two auxiliary sensors. A precision photovoltaic cell is used to measure the irradiance to which the photovoltaic modules are subjected and a contact thermometer is used to measure the surface temperature of the photovoltaic module. From these measurements it is possible to normalize the data for STC conditions.

Irradiance sensor

The irradiance sensor must be installed coplanar to the photovoltaic modules under test, so that it is subject to the same irradiance conditions in relation to the element under test.
Usually, the sensor can be installed using the grounding hole of the photovoltaic modules. The sensor shown in this example has two reference cells, one made of polycrystalline silicon and the other made of monocrystalline silicon. The equipment user must check the module technology to make the appropriate choice.
Temperature sensor
Regardless of whether the test is done with modules or strings, the temperature sensor must be connected to a module that is the reference for the measurement.
The sensor must be connected in the central region of a photovoltaic module in modules where the junction box is located close to the upper frame. If the junction box is in the middle of the module, the sensor must be positioned between the junction box and the frame in the lower region of the module.
The sensor must go through a temperature stabilization process, that is, the test must begin after a minimum period of 30 minutes after installing the equipment. The connection to the curve tracer must be made through appropriate connectors, which fit into the auxiliary inputs of the IV curve tracer, as shown in figure 5.

Configuring Test Parameters
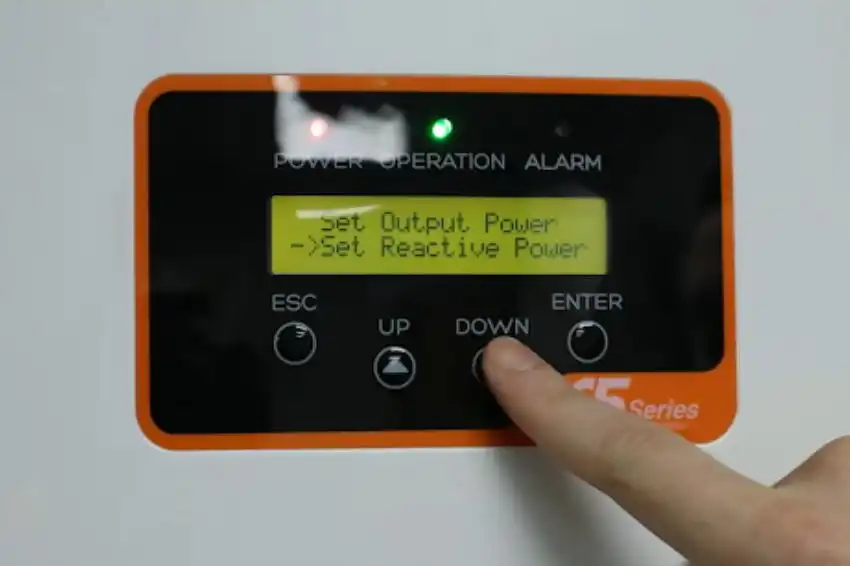
The tracer requires the user to initially enter the parameters of the photovoltaic module under test. To do this, simply register the module with data on voltage, current, power, temperature coefficients and the internal resistances of the photovoltaic module, which can be entered manually or simply collected automatically by the equipment.
In Figure 4, it is possible to configure the number of modules that will be analyzed, the method of insertion of the resistance Rs (photovoltaic module series resistance), the operating time of your system (in years) and the operating temperature of the modules and the minimum interval between two tests.

Connecting the equipment to the test element
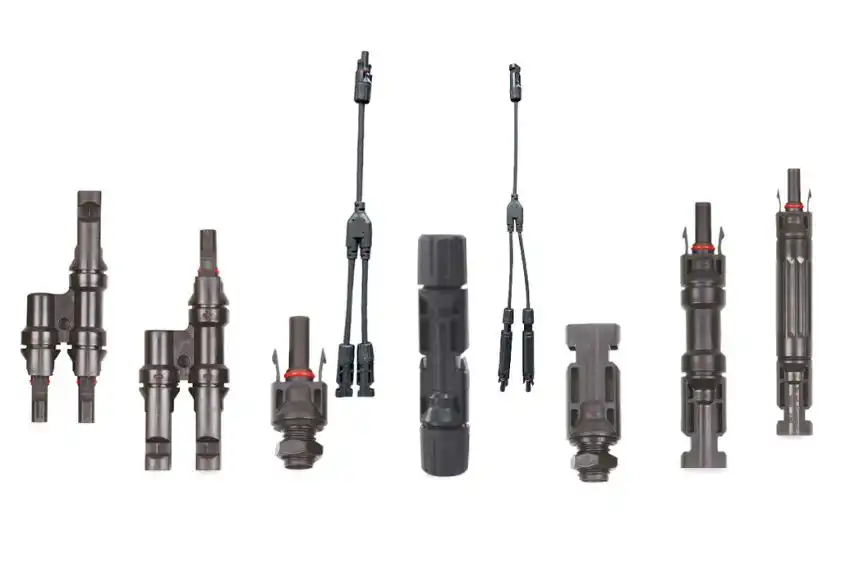
The IV curve tracer is connected to the sample using four cables (green, blue, red and black, in this example) that have two MC4 terminals. The connection is made very intuitively. Just follow the color patterns and inscriptions found on the equipment or in its manual.
The completion of this procedure is shown in Figure 6. The MC4 terminations (Figure 7), therefore, must be connected to the terminals of the module or string to be tested.


After these procedures, you will be perfectly qualified to collect IR data (voltage and current) from the photovoltaic array. The results obtained clearly demonstrate the electrical parameters measured, as well as the IV and PV curves in OPC and STC, in addition to demonstrating the degradation of the module in relation to its nominal power.
Data can be extracted from the equipment through simple USB communication with a computer, enabling a more succinct analysis of the collected data and allowing the curves to be added to photovoltaic commissioning reports.
Case study with the IV curve tracer
To better abstract the concepts covered so far, there is nothing better than a case study to delve deeper into the subject. This study was carried out during the commissioning of a photovoltaic system composed of two strings of 20 modules of 320 Wp (12.8 kWp in total), divided into two different MPPTs of a 15 kW inverter.
Initially, the modules were sanitized to mitigate the effects of dirt deposition on the modules. We then traced the IV curve of one of the strings, and the equipment showed considerable losses. Given this situation, we looked for evidence in the modules that would lead us to sufficient conclusions to take operation and maintenance actions.
Among the measurements collected on the string, an unusual behavior was noticed in one of the modules. Although the module was sanitized and free from shading, the characteristic IV and PV curves showed anomalous behavior in relation to the others.

Figure 7 shows the curves according to the module's nominal conditions (green), in addition to the module's actual conditions (red), both normalized to STC conditions.
With the data collected with the curve tracer and through a visual inspection of the module, it was possible to conclude that the module had its bypass diode damaged to the point that it remained always activated, configuring a situation of a burnt diode in a short circuit.
The clear evidence of this occurrence is based on the fact that the open circuit voltage practically reduced to one third of its nominal value. Nominal data and data collected in the field are compared in Table 1 below.
Table 1: Comparative data between the parameters provided in the datasheet and those collected in the field with the curve tracer
 During photovoltaic commissioning, it is very common to carry out Voc measurements of strings, instead of measurements at module level. This is understandable, since structures do not always favor measurements and depending on the size of the system, it would be a complete dream to carry out measurements from module to module.
However, in a system of 40 modules it was possible to find a module with generation noticeably below its nominal power, representing around 1.5% of drop in the total system generation.
Assuming that this module belonged to a string with modules operating under nominal conditions, the voltage would go from 927.8V (20 modules with open circuit voltage at STC of 46.39 V) to 910.26 V – a variation of approximately 1% at full open circuit voltage.
This problem would probably not be noticed in a commissioning done at the string level. The voltage variation would probably be interpreted as dirt or a measurement error. But in fact, as demonstrated in this case, a module may have a factory defect or a failure caused by an installer who did not act diligently.
Conclusion
The IV curve tracer is a piece of equipment that has a high acquisition cost on the market, which ends up making its dissemination unfeasible, especially among small and medium-sized integrators. However, the curve tracer proves to be an important and powerful piece of equipment in photovoltaic system commissioning activities, allowing the identification of installation errors or defects in photovoltaic modules and strings.


One Response
Hello, how to select the correct tracer?
For example, I can use the 15A tracer to measure a single 550W module; 17A (Impp) and 31V (Vmpp)?