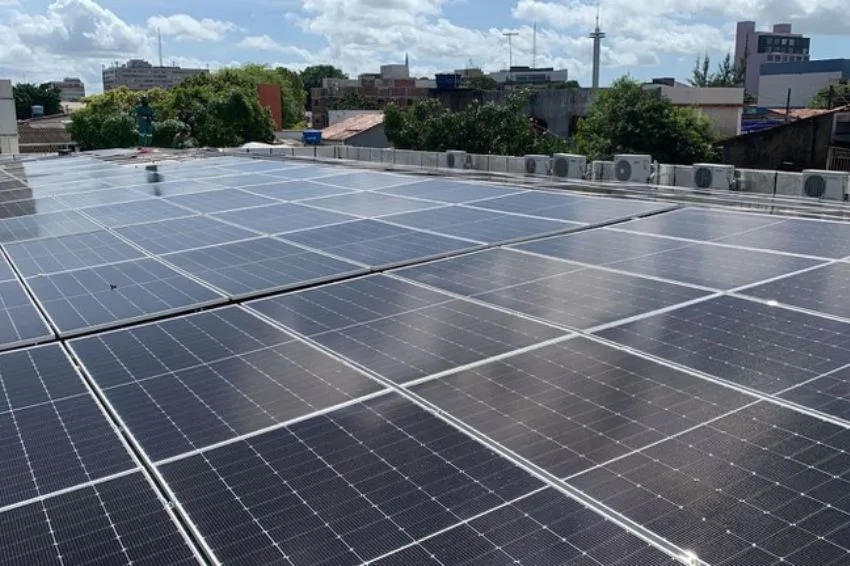
Even in the face of a chaotic scenario and uncertainties caused by the coronavirus pandemic, the GD (distributed generation) solar closed the first quarter of this year with the second best performance in its history.
In the first three months of the year, the sector generated a volume of 500.20 MW of installed power and around 50.4 thousand photovoltaic systems installed.
This is a performance that falls short only of the amount recorded in 2020, when the country had 676.8 MW of power and 55.4 thousand photovoltaic systems installed between the months of January and March.
The data were obtained from the report of the Solar Channel next to ANEEL (National Electric Energy Agency) on Thursday (1st). Compared to the other first quarters of previous years, the performance of solar DG in 2021 is considerably higher.
In comparison, for example, with the first quarter of 2019, which recorded 226.11 MW in installed power and around 18.4 thousand photovoltaic systems, the increase was greater than 100%.
It is worth mentioning that in 2019, the pandemic was not even a reality in the world. In Brazil, the first case of contagion registered by the authorities occurred in the final stretch of February of the following year. The first confirmed death was recorded by the Ministry of Health in the second week of March, in a resident of the city of São Paulo.
Solar energy ranking in Brazil
In the first three months of this year, the Brazilian regions that generated the most solar energy were the Southeast, with 193.25 MW of installed power and more than 22.3 thousand systems; and the Northeast, with 103.57 MW of power and 8.7 thousand systems.
Soon after, the Central West (84.21 MW and more than 7.1 thousand systems) and South (84.67 MW and approximately 9.3 thousand DGs) regions appear. The North of the country, in turn, was the Brazilian region with the lowest generation of photovoltaic energy, with 38.63 MW of installed power and around 3.3 thousand units sold between January 1st and March 31st.
Check out GD solar's performance in the last five first quarters
| Year (January to March) | P. Installed (MW) | DG Units |
| 2017 | 15,97 | 2.225 |
| 2018 | 67,93 | 5.977 |
| 2019 | 226,11 | 18.404 |
| 2020 | 676,80 | 55.485 |
| 2021 | 504,33 | 50.928 |
Check out the regions of Brazil that generated the most solar energy in 2021
| Region | P. Installed (MW) | QTY of DGs |
| South | 84,67 | 9.312 |
| Southeast | 193,25 | 22.347 |
| Midwest | 84,21 | 7.128 |
| North East | 103,57 | 8.767 |
| North | 38,63 | 3.374 |
Check out the ten cities that generated the most installed power in 2021
| Counties | MW |
| Cuiabá-MT | 8,64 |
| Teresina-PI | 7,15 |
| Terenos-MS | 5,57 |
| Petrolina-PE | 4,06 |
| Goiânia-GO | 3,98 |
| Rio de Janeiro - RJ | 3,68 |
| Manaus-AM | 3,62 |
| Fortaleza-CE | 3,53 |
| Rondonópolis-MT | 3,40 |
| Várzea Grande-MT | 3,39 |
Check out the ten cities that installed the most solar DG units in 2021
| Counties | QTY |
| Cuiabá-MT | 1.074 |
| Teresina-PI | 670 |
| Uberlândia-MG | 626 |
| Rio de Janeiro - RJ | 432 |
| Várzea Grande-MT | 394 |
| Rondonópolis-MT | 372 |
| Petrolina-PE | 362 |
| Goiânia-GO | 350 |
| Presidente Prudente-SP | 349 |
| Santa Rosa-RS | 344 |


