Deciding where to invest money is not an easy task. The investment market is broad, with products that cover low and high risk assets and returns.
The large increase in the number of individual investors on the stock market is proof of the greater desire of ordinary people to diversify their investments. It is natural then that a certain “competition” arises between investments.
Where should I invest my money? What risks am I willing to take for such profitability? These are questions that arise when we are faced with all the possibilities for financial support.
It’s no different with solar energy.. For consumers who ask these questions, it is natural to look for a way to compare investment in solar energy with other forms of investment in the financial market in general.
To illustrate possible investment choices, let's compare the accumulated cash flows between a solar system paid upfront, a financed solar system, a solar system whose energy savings are reinvested, an investment with a return equal to the SELIC rate (such as, for example, the Treasury Direct Selic), an investment with a return of 5% (CDB from banks) and 12% (medium or high risk funds). It is worth remembering that, as a rule, the greater the investment risk, the greater the financial return.
The accumulated cash flow is nothing more than the sum of the financial result for a given year added to the results of previous years. This way, we are able to evaluate the accumulation of money over time.
The solar system analyzed corresponds to a 4 kWp residential system installed in the city of Campinas (SP), with a final cost of R$ 20 thousand, capable of generating 6,500 kWh/year. The savings generated by the system are calculated using an energy tariff of R$0.78 and annual system generation decay of -0.9% per year.
For competing investments, we will assume that liquidity is high, that is, that there is no minimum period for withdrawing the initial amount plus interest captured. We know that the liquidity of the principal investment in solar, that is, the sale of the solar equipment from the owner to someone else, is very unusual. Therefore, we cannot assume that the R$ 20 thousand of the system cost can be “withdrawn” from the investment, unlike competing investments.
To reflect this difference in liquidity, in the accumulated cash flow the solar system that is paid upfront will represent a negative initial value of R$ 20 thousand, while competing investments will be represented by a positive initial value of R$ 20 thousand.
This difference in liquidity means that in purchase of the photovoltaic system the amount invested is immobilized and will need to be recovered, which is why it appears as a negative value at the beginning of the cash flow.
On the other hand, in a common investment the capital placed continues to be available, that is, the person continues to have the amount, which can be withdrawn at any time (in the immediate liquidity hypothesis that we are adopting).
It is important to remember that this visualization of accumulated cash flow is not capable of quantifying the risk of investments. However, we know that investing in solar energy is very safe, after all, the trend of energy tariff growth is strong and the sun always rises the next day, with the risk being linked only to equipment defects.
The Selic Treasury Direct and bank CDB also present little risk, however, little profitability. Investment funds that have shares, dividends, derivatives, dollars and other financial instruments in their portfolio are much more exposed to market risks, such as economic crises (2008, 2016 and now, 2020), dollar variability and scenarios internal and external.
We will begin by comparing the financial performances of the following solar energy investments and two low-risk financial investments:
- Solar system paid in cash;
- Financed solar system (12% per year in 5 years);
- Treasury Direct Selic 2%;
- CBD 5%.
The graph in Figure 1 shows the accumulated cash flow over 25 years for each of the investments analyzed.

As we can see, even considering the difference in liquidity between investments, the Investing in solar energy in the medium and long term performs better than low-risk investments. To analyze the performance of the solar system compared to higher risk investments, let's now compare the following investments:
- Solar system paid upfront, without reinvestment of electricity bill savings;
- System paid in cash whose savings generated on the electricity bill are reinvested in an investment of 2% and 5% pa;
- Investment fund with a return of 12% pa
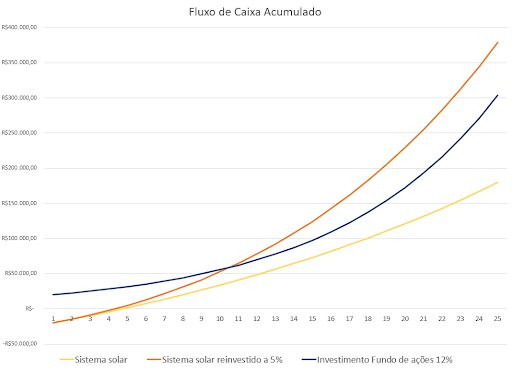
Finding an investment that yields 12% per year is not difficult. However, finding a low-risk investment that yields 12% per year for 25 years and, even more, without loss intervals, becomes a task that borders on impossible. It then becomes evident that benefit of investing in a photovoltaic system.
We can say that a good part of residential customers are attracted by imagining the savings provided by the solar system, and what this represents in terms of extra money for the purchase of consumer goods and well-being in general.
However, we can think of another scenario for allocating part of this savings, such as a traditional investment. Let's assume a second scenario: half of the money saved is invested in a low-risk investment of 5% per year or in a high-risk investment of 12% per year
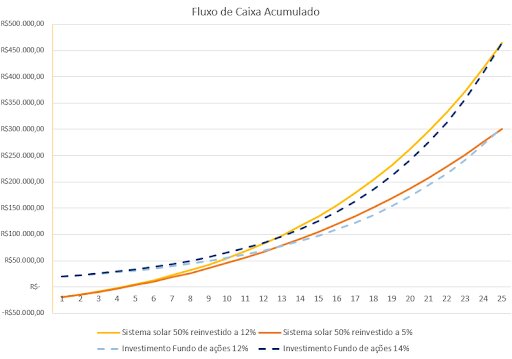
In this last scenario, where the customer reinvested only half of the system's annual savings, the investment in solar energy still outperformed medium and high risk funds with high rates of return. The comparisons of the scenarios above show that even for customers who feel comfortable with investments in the financial market and their risks, installing a solar system is still advantageous.







3 Responses
Good article, but they weren't included in the calculation:
– costs related to panel maintenance
– periodic cleaning costs
– risks related to changes in legislation with possible taxation of energy generated by the panels.
– risk of accident (hail, theft, etc…) or insurance of the panels or increase in home insurance considering the existence of the panels.
– loss of energy efficiency and lower energy production over the years
– considerable loss of principal (cost of panels) in case of sale of the property.
– risk and cost of electrical defects in the system
Furthermore, at the end of the investment the principal still exists, while the panels have zero resale value at the end of their useful life.
Do you think what I said makes sense?
Excellent article Matthew, very educational.
I really appreciate Mateus' articles, specifically in this one it was not possible to understand the graphic comparisons due to the lack of captions to indicate which color each item corresponds to.