After installing the photovoltaic system, the anxiety about keeping up with energy generation and saving money is great. The customer and installer usually follow up every day, perhaps every hour for the first 30 days.
Although the focus is on energy generation, monitoring provides a range of information that is just as important.
Mainly alarms, fault detection and analysis of loss of performance of a component or the entire system.
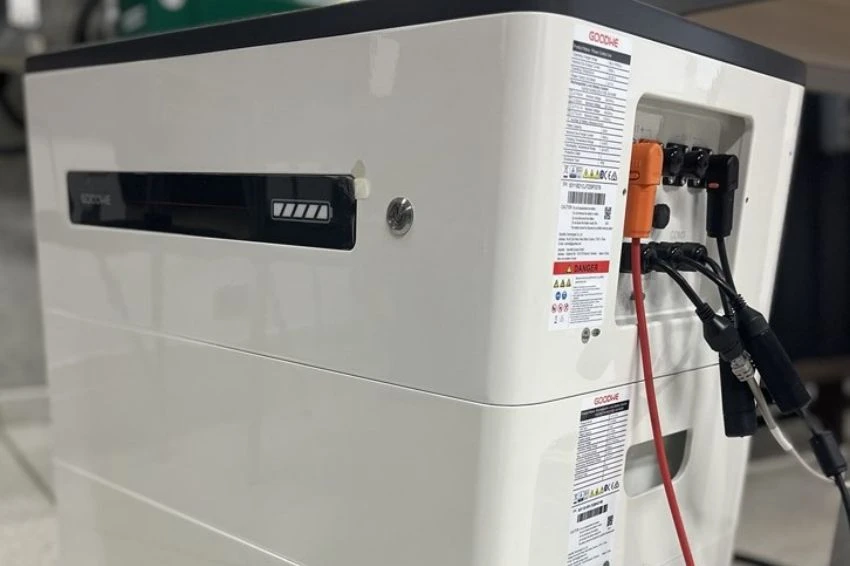
Every photovoltaic system has monitoring, however, system monitoring with string inverters “sees” the entire string without being able to detail module by module.
For a photovoltaic system with optimizers, monitoring can be much more detailed and facilitates the detection of faults, performance losses and alarms.
string system versus Optimizers
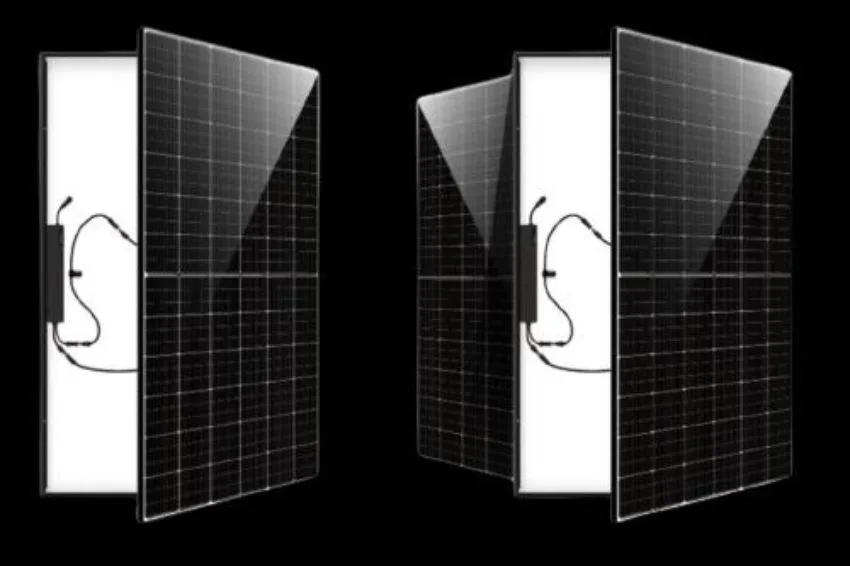
The traditional photovoltaic system connects modules in series forming strings. The strings are connected into multi-string inverters, with one string per input.
Therefore, the monitoring, present in the inverter, can analyze the electrical characteristics per string.
The photovoltaic system with optimizers connects each optimizer into one or two modules. Thus, it is possible to measure each optimizer, making monitoring much more detailed.
![Figura 1: Sistema tradicional com módulos conectados em string vs. Sistema com otimizadores com cada módulo conectado a um otimizador [1]](https://novo.canalsolar.com.br/wp-content/uploads/2020/05/Sistema_tradicional_com_modulos_conectados_em_string_a_esquerda_e_sistema_com_otimizadores_a_direita_606x131.jpg)
As an example, we have an installation with modules facing North. All with the same orientation and inclination (Figure 2).

It can be seen in figure 2 that the modules are not generating the same power at the time of analysis. Whereas, in a system with strings, all modules would be limited by the lowest generation.
In this system, we have two modules connected per optimizer. It is possible to analyze the information at the same time from an optimizer with modules featuring low generation (24.1 W) and high generation (203.91 W).
Figure 3 shows two curves for each optimizer analyzed: voltage and photovoltaic power. It is possible to notice an increase in voltage in the shaded module (MPPT correction) and a decrease in power.

With individual monitoring per optimizer, it is possible to observe how much each module is generating individually. And discover possible flaws by comparing them.
Performance below estimates
After installation of the photovoltaic system and the entire approval process with the concessionaire, when generation is lower than expected, the causes can be several: system sizing error, shadows, or just one module that affects all others connected in series.
String monitoring makes it difficult to detect problems in modules that affect the entire string. This problem can be caused either by an external factor, such as shadows or dirt, or internally, such as a failure in the module or in the case of a module with different characteristics than the others.
It is up to the installing company to find out what and where the problem is. And panel-level monitoring with greater detail of information would make the work much easier.
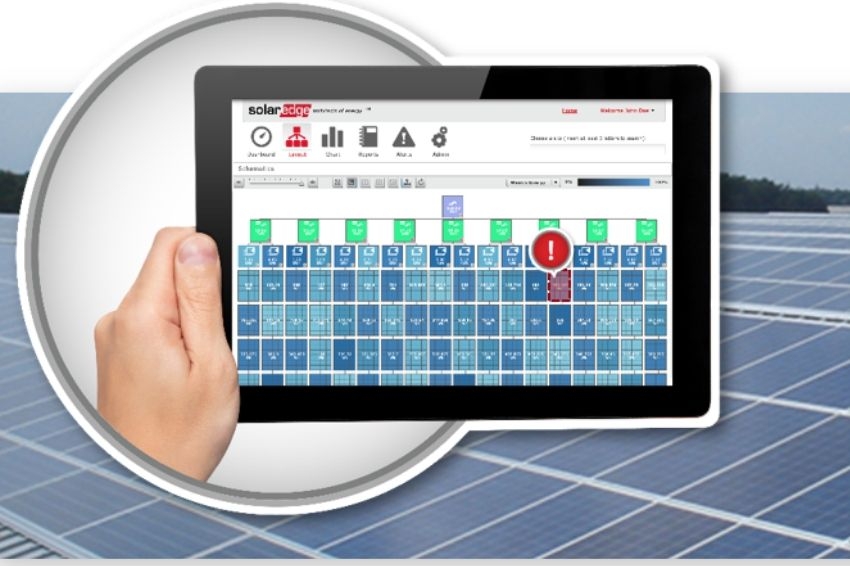
In the case of monitoring by the company SolarEdge, a manufacturer of optimizers and inverters, it is possible to compare, in addition to the generation of each year, the generation of the installation of a given month year by year.
![Figura 4: Dados abrangentes do rendimento, com comparações ano a ano [2]](https://novo.canalsolar.com.br/wp-content/uploads/2020/05/Dados_abrangentes_do_rendimento_com_comparacoes_ano_a_ano_2-789x316-1.jpg "Figure 4: Comprehensive yield data, with year-over-year comparisons [2]")
Bypass diodes
Every module has bypass diodes installed during manufacturing, usually three. When a system failure occurs, it is possible that one or more diodes will burn out.
Burning out of a diode is easily detected when analyzing the operating or open circuit voltage of a module. However, in a string, this voltage loss is masked due to the high voltage level.
Example 1
A module with Voc = 45 V, presents a Vmpp = 36 V (in STC), with a burned bypass diode, presents a Voc = 30 V and Vmpp = 24 V. Figure 5 shows a real monitoring with each optimizer connected to two modules.
![Figura 5: Monitoramento de otimizadores ligados a dois módulos cada [1]](https://novo.canalsolar.com.br/wp-content/uploads/2020/05/Monitoramento_de_otimizadores_ligados_a_dois_modulos_cada_1-380x309-1.jpg "Figure 5: Monitoring of optimizers connected to two modules each [1]")
The voltage observed in one of the optimizers is 17% lower than the voltage in the others. As a comparison, if there were two strings with ten modules each and one of them had a burned bypass diode, the operating voltage of this string would present a value 4% lower than the other, an almost imperceptible difference.
Note: it is interesting to note in figure 5 the variation in the Vmp value during the day, the value decreases to 64 V with the increase in temperature and returns to 70 V at the end of the day.
Example 2
Two strings, with ten modules of 330 Wp each, generate energy during a certain day, reaching a peak of 2,350 W around noon. If one of them has a burned bypass diode, the difference in the generation curves would be minimal.
If these twenty modules were connected to ten optimizers, the difference in generation curves would be much more noticeable. Figure 6 shows the generation curves for strings and optimizers.

PID
O PID effect (Potential Induced Degradation) causes an inevitable loss of power in photovoltaic modules each year.
This loss may be greater or lesser in different modules even if they are from the same manufacturer.
In a string, all modules work limited by the one with the lowest power, and in classical monitoring it is impossible to understand the loss due to the PID effect.
As monitoring in optimizers shows module by module, it is possible to observe the evolution of the PID effect in different modules.
Figure 7 shows different power values generated in the same installed system due to the PID effect.
![Figura 7: Potência gerada por diferentes módulos fotovoltaicos no mesmo sistema [1]](https://novo.canalsolar.com.br/wp-content/uploads/2020/05/Potencia-gerada-por-diferentes-modulos-fotovoltaicos-no-mesmo-sistema-534x362-1.jpg "Figure 7: Power generated by different photovoltaic modules in the same system [1]")
References
- [1] IV Curve Tracing vs. SolarEdge Real Time Monitoring. SolarEdge Technologies. Version 1.0. April, 2019.
- [2] Handelsman, Lior. Optimize your O&M Procedures with Optimized Management of your PV system – Implementing a PV plant supervision system to reduce Operation and Maintenance (O&M) costs and increase profitability.