In times when almost all devices and people are connected, and the most valuable companies in the world are technology giants that have some equipment or product that allows them to be in constant contact with the user, collecting data or providing them with information, The importance of an efficient monitoring system applied to photovoltaic plants is indisputable, regardless of the generation capacity of that installation, whether small or large.
According to report No. 19, updated on May 4, 2020, by ABSOLAR (Brazilian Association of Solar Photovoltaic Energy), Brazil has over 228 thousand solar photovoltaic systems connected to the grid.
This large volume of connected units represents a great opportunity for companies and installers that aim to deliver a differentiated service and expand their business.
For this to happen, two requirements are necessary: firstly, a good online monitoring system, capable of extracting essential data and information for the operation of the installation. Secondly, the person responsible for the installation must have the ability to interpret the reports generated.
In this sense, we can ask ourselves: what are the trends and opportunities that will appear in the future in the photovoltaic market? Below are just three of the many that are yet to be discovered:
- Proactive service: maintenance and conservation in a preventive or predictive manner, using concepts from the so-called industry 4.0. At this point it is possible to increase the efficiency of the system, guaranteeing greater energy generation, as installation shutdowns due to failures are avoided;
- Commercial actions and offering of new products and services: based on data analysis and reports, it is possible to find behavior patterns in the end customer's installation and thus propose infrastructure improvements, system automation or expansion;
- Fault detection: constant monitoring so that in the event of a failure, the customer can be attended to quickly and energy generation is interrupted for the shortest possible time.
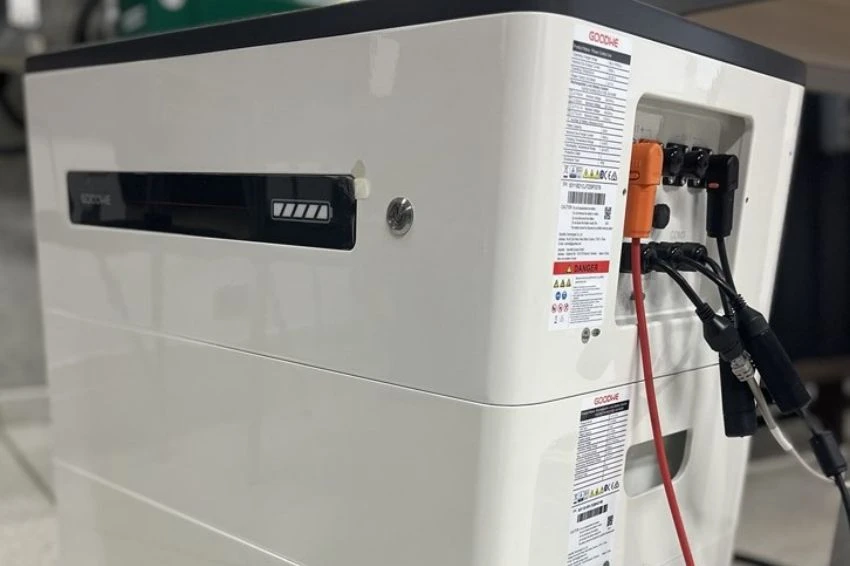
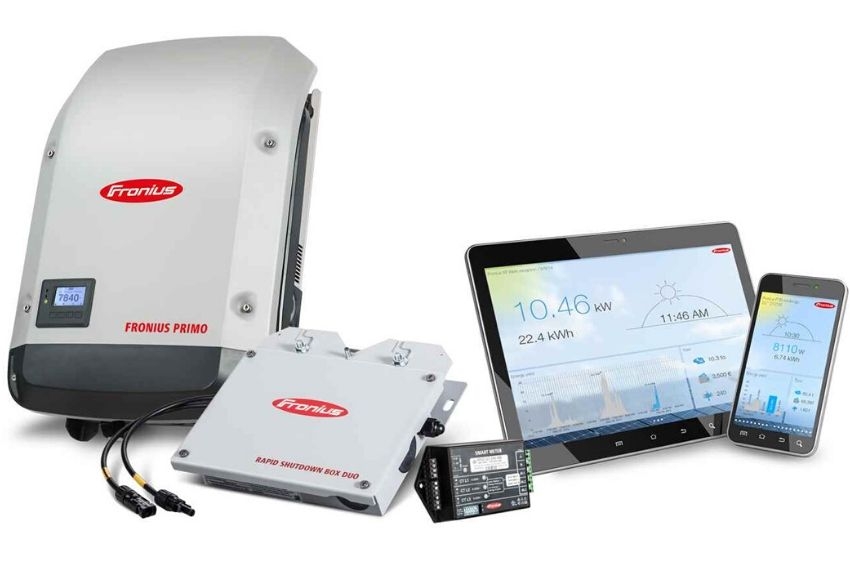
Given the relevance of these functions and characteristics, it is clear that we need to invest in companies with a long-range vision, which make investments related to the management of this data. As shown in Figure 1, the Fronius Primo inverter, like the entire line of Fronius inverters, has monitoring integrated into the equipment.
The Solar.web monitoring system can be accessed from any PC, smartphone or tablet platform. In this sense, in this article we will elaborate the main steps so that it is possible to analyze the voltage and current at the MPPT inputs of a photovoltaic inverter and what conclusions we can obtain.
Among the necessary steps, some need to be carried out at the installation site during the start-up of the photovoltaic inverter and others can be carried out later using a PC or smartphone.
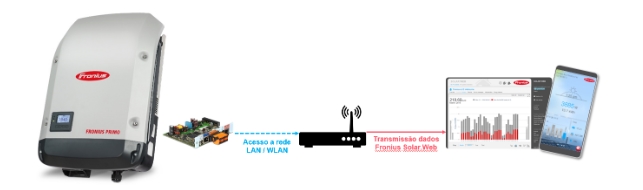
Step 1: Connect the inverter to the internet network present in the installation, with the possibility of the connection being made via an Ethernet cable or Wi-Fi.
Step 2: Configure the connection between the inverter and the internet network.
Step 3: Create an account on Solar.web from Fronius. To do this, we will discuss some important tips that can help and greatly facilitate the management of all your projects.
- From the date of publication of this article, and for a limited time, the company Fronius made the Premium version of Solar.web available free of charge, only for the Brazilian market. With this upgrade, it will be possible to maintain the entire data history of your installation since the inverter began operating, so this is one of the basic prerequisites for efficient monitoring.
- Try to keep all your installations in a single Solar.web account. As a good practice, it is possible to create an email for your company and thus register all installations carried out in this account. It is important that you have an overview of all the projects you have developed.
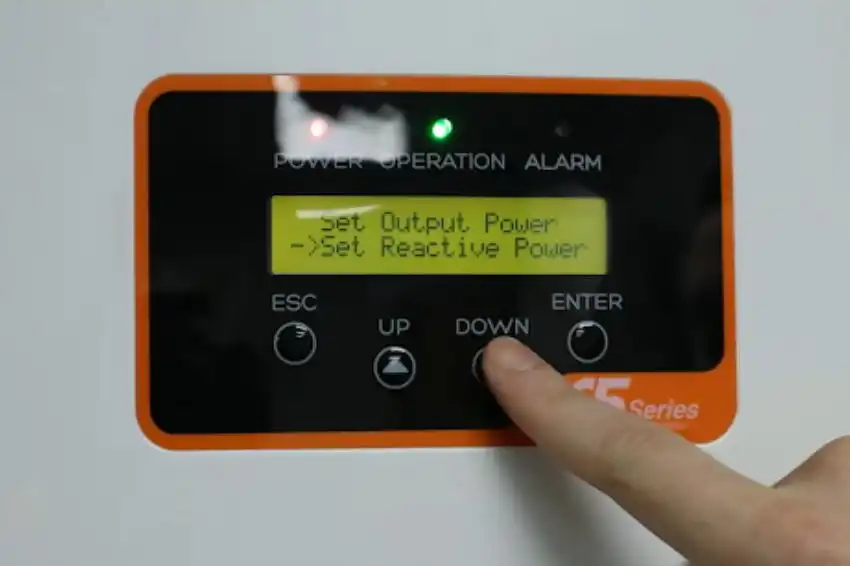
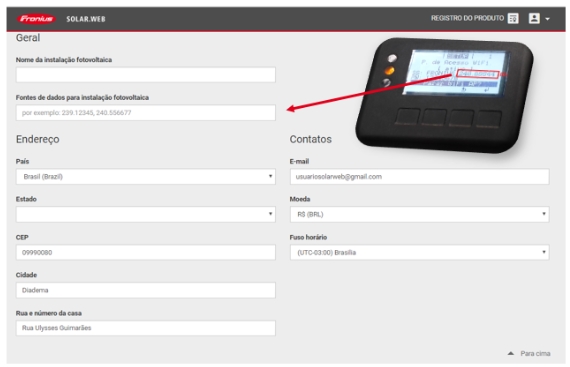
Step 4: Add all inverters present in the plant to your installation. To carry out this step you need to have your Datamanager/Data Source number (240.xxxxxx), which can be read through the inverter display as shown in Figure 2. In addition, you must include location data for your installation, and here we have another important tip.
- After filling in the data and confirming it, you will be able to register the warranty extension for your inverter. To do this, you need the serial number of your equipment. After adding the installation, registering the inverter and issuing the warranty certificate, in accordance with Fronius policies, you receive an additional 5 years free of charge to the standard 2-year warranty, for a total of 7 years of warranty.
Step 5: Enter user rights to your installation. The installation will be registered in your account, but it is possible to grant access rights to other Solar.web users so that they can view energy generation data.
As a detailed reference for each of the steps mentioned, there are two suggestions for installers. The first is to download the Fronius – Support and Installation app for Android and IOS, where the user can find documentation and detailed procedures for configuring monitoring. The second suggestion is access to the FroniusSolar YouTube channel, with complete presentations about Solar.web.
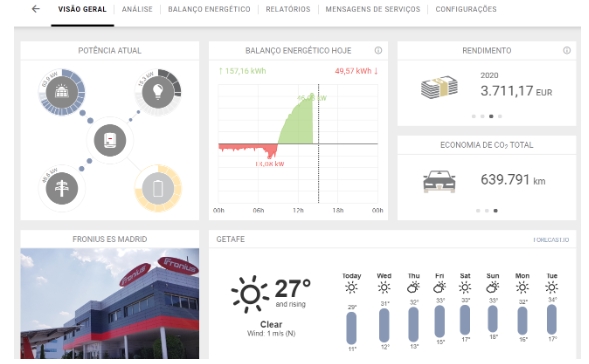
Following the execution of all steps, at the end the inverter will be online sending data to Solar.web. In Figure 3 we have the application's initial screen, where it is possible to check general installation data such as current inverter power, loads and surplus.
The “energy balance today” shows the amount of daily energy consumed (in red) and generated (in green), as well as information on performance, climate forecasts and an image of the installation.
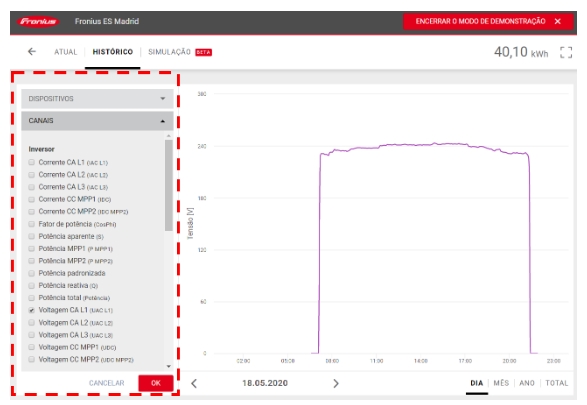
On the home screen, we can select the “analysis” tab and then “history” to view the current graphs or data history. When entering this environment, it is possible to select the installation inverter, if there are multiple ones, that we wish to access. Figure 4 demonstrates the interface of the “history” screen, using as an example the installation of the Fronius office in Madrid.
We can select through the side toolbar which variables will be transported to the chart, according to the chosen date. It is worth highlighting the number of measurements that the inverter is capable of performing, which is an advantage depending on the information you will need to resolve any installation difficulties.
To display the graph of MPPT 1 current and power, simply select these options from the list (MPPT1 DC Current and Total Power). Figure 5 and Figure 6 demonstrate both variables on different days.
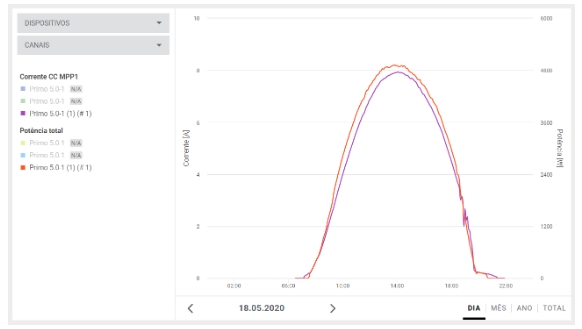
Observing Figure 5 from Day 1, it is possible to identify an almost “perfect” parabolic behavior, where current and power follow the expected pattern for a photovoltaic system.
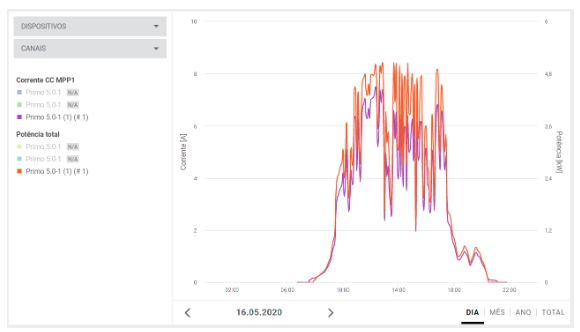
In Figure 6 of Day 2, the behavior was opposite to Day 1, where it is possible to identify an intense oscillation in power and current levels throughout the day. The first possible conclusion is that Day 2 probably had a bad weather condition with cloudiness and shading over the modules, which can be compared with the weather forecast indicated on the initial screen.
The second is as the graphs are different in behavior and it is not possible to find oscillation patterns, both for power and current, the shading is caused randomly, that is, this installation must not have a shadow due to some object or structure close to the modules.
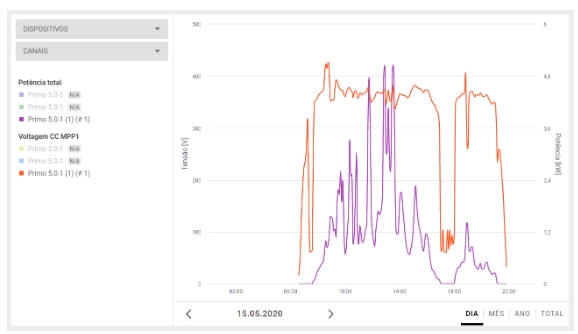
When voltage is taken into account, the same analysis can be performed. Figure 7 demonstrates the power curve and voltage applied to the MPPT1 input. Observing the period between 17:00 – 18:00h, the inverter power is reduced to zero and the voltage fluctuates within the equipment's operating limit based on information from the Primo inverter datasheet.
This behavior indicates that there was a disconnection, even if partial, of the arrangement, or even the inverter shutdown due to a voltage fluctuation on the alternating connection (AC).
Obviously the graphical analysis only directs us to a possible elucidation of the fault, it is necessary to observe other indicators such as the inverter status itself. With this information, the installer will be able to proactively propose solutions and services to customers, according to the opportunities mentioned at the beginning of the text.
Conclusion
In this article we argue about the importance of an efficient monitoring system and show the trends and opportunities that will result from the increase in the volume of systems and companies that have the ability to monitor and manage data remotely.
Furthermore, it is exemplified how a quick graphical analysis can provide some information and guidance that avoids loss of efficiency due to interruption in energy generation or additional costs for travel and services, without a strategy based on data and system behavior.
It is up to the installer to seek knowledge about communication topics and network protocols, know how this is applied within a photovoltaic plant and know the importance of techniques linked to system automation.
For more details and information, we recommend visiting the Fronius YouTube channel at playlist Brazil and access to website demo environment.