Article originally published in the 20th edition of Canal Solar Magazine
The heat waves that we experience in the period from November 12th to 18th, 2023 tend to be more frequent and with greater intensity due to the climate changes that are already underway.
Studies by the IPCC (Intergovernmental Panel on Climate Change) indicate that with the increase in the planet's temperature, extreme events such as an increase in temperature, as well as others related to climate variables, tend to worsen.
The average increase in temperature and its fluctuations end up increasing energy demand, presenting power peaks. The graph in figure 1 shows the relationship between increase in temperature and increase in system demand, observing the history available on the ONS website.
Depending on the average temperature of the day, an increase of one degree during the day causes or does not increase the electrical charge. For low average temperatures, an increase of one degree may represent a decrease in the electrical charge, which is very common in countries in the northern hemisphere.
In the Brazilian case, with average temperatures of 23 to 25 degrees, an increase of 2 degrees corresponds to an increase of 2.1 % in the system load in the Southeast region. This relationship is explained by the refrigeration and air conditioning loads that are more critical in the early afternoon when the sun is strongest.
This relationship observed in history tends to increase as consumers increasingly seek to minimize discomfort due to heat.
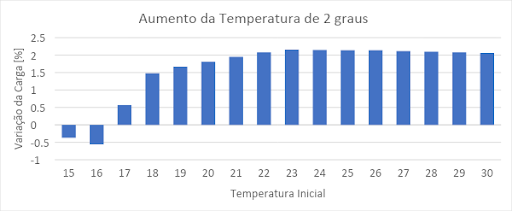
Load variation depending on temperature variation. Source: MC&E for PEE 2050 State of São Paulo in public consultation
The graph also shows that for periods with average initial temperatures around 17 to 19 degrees, a positive variation of 2 degrees causes a much smaller peak in load and may even be negative for lower temperatures. This shows the nonlinearity of the load response with temperature variation that must be considered.
Returning to the period of high temperatures observed in November, in the Southeast and Central-West regions, for example, where the largest load in the Brazilian electrical system is concentrated, demand peaks were observed basically around 2 pm, especially on Thursday ( November 16, 2023) which reached 61,482 MW.
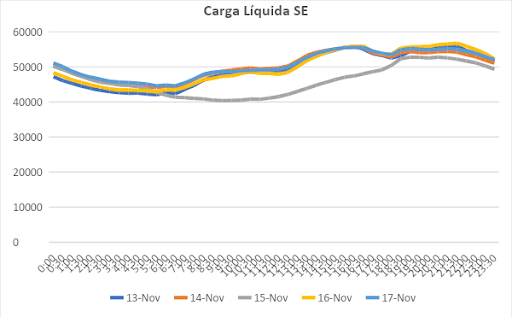
This month, we could have had power problems in the SIN (National Interconnected System). Figure 2 shows the load curves for the four working days of the week and Wednesday, which was a holiday.
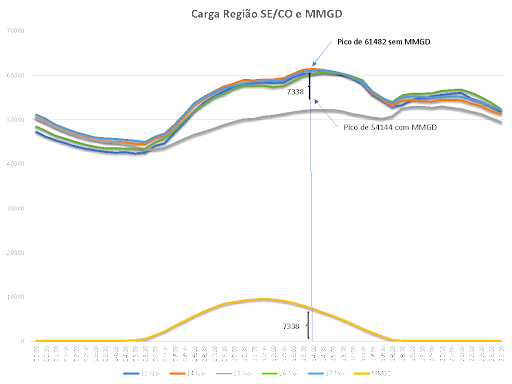
Global load and MMGD generation. Source: ONS data
In the same graph in figure 2, in yellow, there is also the MMGD generation curve (distributed micro and mini generation) where there were practically no clouds in this region this week. At the time of maximum demand we had a total of distributed generation of 7,338 MW which alleviated the peak demand as shown in the graph in Figure 3 where the net load curve is plotted.
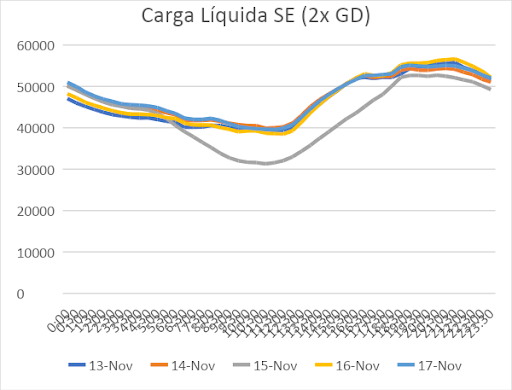
Net load considering DG. Source: ONS data
Thanks to two factors, we did not have problems with lack of power and consequent changes in the frequency of the system: the reservoirs of the hydroelectric plants in the southeast, which were at satisfactory levels, and distributed generation.

It can be seen that the peak demand without DG (distributed generation) would occur on the 14th at 2 pm with a value of 61,482 MW. Considering DG, the peak was 54,144 MW at 2 pm on the same day. There was, therefore, a decrease in the SIN tip of 7.34 GW due to DG, that is, 11.8%.
This demonstrates that the benefit of DG is not negligible even in the displacement of thermal generation, that is, many contracted thermal plants might not be necessary.
It is clear that the tip is not covered only by DG and thermal plants were activated, but it is important to highlight that in addition to this joint benefit to the SIN, it is located very close to the load, relieving the transmission and distribution networks at these times. This relief minimizes investment in expanding networks, making the system more efficient.
Given that DG is predominantly solar-sourced, there is concern about a decrease in generation in periods with clouds and precipitation. However, with the decrease in solar incidence during these periods, the air conditioning and refrigeration load also decreases, that is, there is a positive correlation minimizing the peak power.
At the public hearing for the improvement of REN 482/12 in 2019 (AIR 1/19), ANEEL (National Electric Energy Agency) used the ELCC metric (Equivalent Load Carrying Capacity) that identifies the contribution of the energy source to the reliability of the system when there is an increase in load.
It was observed that the solar source in Brazil has a higher ELCC than in the USA due to the peak time of the system. The contribution of DG in Brazil has a peculiar characteristic not observed in countries with colder climates.
Unfortunately, that same year, ANEEL, after several discussions, launched CP 25/19 where it abandoned all the work carried out and imposed the entire cost of the wire and free energy compensation charges only on TE.
The positive effect of DG measured through ELCC tends to decrease with increasing penetration as it is not a dispatchable source. Figure 4 shows the new curve if the level of solar DG penetration doubled its current value and the load remained at the levels of the week of the 13th.
The tip is observed moving towards 8 pm and with a shape close to the duck curve (see Wednesday's curve). It is important to mention that there is a real concern for the operation of the system with the ramp starting at 4 pm but that it should be effective based on much higher DG penetration rates than in other countries.
Net Load doubling DG capacity
When the increase in penetration reaches high levels, we can use solutions such as battery storage to improve the ELCC and the duck curve ramp, which is already a reality outside Brazil.
Finally, it is important that the MME (Ministry of Mines and Energy) and ANEEL quickly establish guidelines and tariff regulation observing the costs and benefits of DG (distributed generation) as determined by Law 14300/22.
It would be interesting to use the concepts brought in AIR 1/19 and update them in order to resolve the current impasse. The generalization used here only brings a warning not to criminalize DG, but it is necessary that when quantifying the gains, the particular effects on the feeders, that is, on the medium voltage networks, are considered.
The opinions and information expressed are the sole responsibility of the author and do not necessarily represent the official position of Canal Solar.