
The use of solarimetric stations It is common in large plants and is mandatory in the case of enterprises that participate in energy auctions promoted by ANEEL. However, its use is not restricted to these scenarios only.
We can implement a set of extra sensors to extract data that inverter monitoring alone cannot capture.
For example, to answer the question “Is my solar plant generating as expected?” with greater precision, it will be necessary to use sensors that are not integrated by default in the inverters.
How do you know if the deviation from what was projected to what was measured is due to some climate variation or inaccuracy in the database? How do you know if it was not an installation problem that was not detectable by the inverter?
Project simulation
To discuss the benefits of implementing extra sensors and to be able to answer the question “is my solar plant generating as expected?”, we need to understand the simulation process of the software used in the projects.
Simulation software contains an entire mathematical apparatus to relate the power of devices, loss mechanisms and meteorological data with an estimated value of energy generation. Electrical data and phenomena and devices are precisely modeled.
Meteorological databases are usually created for a typical year (known as TMY – Typical Meteorological Year), made up of the average of several years (typically 10). When we simulate a system and implement it, we are using a typical weather year and a specific loss calculation to try to “predict” the future of that generation.
When we accurately capture the meteorological data of a year that “happened” and all the loss processes measured or calculated in a plant and feed the software back with this data, we have the accuracy of the programs, that is, the difference that the program estimates and The measured energy is in the order of 1 to 2%.
Figure 1 illustrates two simulation procedures that can be employed. In the first, the software only uses data from a typical meteorological year. In the second, the software uses data from a previous year, for which there are measurements carried out at the plant. The difference between result 2 and the generation measured at the plant is in the order of 1 to 2%. This is the precision of the software.
There may be variations between meteorology and the exact calculation of losses when we want to imagine the future performance of the plant, which can cause our system to generate more or less than initially projected. To resolve doubts about performance, it is essential to use extra sensors.
If we are faced with a project in which the simulation is very different from what was measured, or we have a modeling problem - for example, an error in loss calculations or we have some external influence occurring -, assembly and equipment defects, problems with configuration or an atypical meteorological year, outside the average. Some of these deviations can be measured with the sensors discussed in the article.
Generation analysis methods
There are some comparison methods that we can use to understand whether the plant is generating what was planned or not. They are: calculation of specific energy, calculation of global performance (known as Performance Ratio – PR) and measurement of the IV curve.
Specific Energy – kWh/kWp
Specific energy is defined as the amount of energy generated during the analysis period divided by the STC power of the modules, commonly expressed in kWh/kWp in one year. This number is easy to measure at the plant: simply divide the entire amount of energy generated during a year (which is obtained by monitoring the inverter) by the nominal DC power of the same.
Large variations in specific energy between measured and projected values may indicate: plant modeling error in the software, technical problems with the plant or influence of external variables such as, for example, excess dust beyond what was imagined, climatic year with cloudy day regime out of average etc.
In principle, we do not need extra sensors to use specific energy as an analysis method. However, there is an important counterpart to using specific energy as a comparison of what was projected with what was realized: the method is not able to say whether there is a defect in the plant or whether another external influence caused the deviation. For example, let's imagine 3 scenarios:

- A projected plant has an estimated energy of 1500 kWh/kWp in the first year. Measurements at the end of the plant's first year of operation match expectations. The meteorology was very close to the average used by the software and there are no loss processes that were not modeled;
- The same plant in the scenario above was installed in an atypical meteorological year: the rainfall and cloudy days were lower than average, enabling the capture of over 2% of light energy in the module. In this same plant, there is an assembly defect that generated an additional loss of 2% of energy. Result: 1500 kWh/kWp of specific energy;
- The plant in scenario 1 was installed in an atypical meteorological year: 2% less light energy, and there are no loss processes that have not been modeled in the software. Result: 1470 kWh/kWp.
In other words, using only specific energy to decide whether the plant generated what was expected could mislead us. In scenario 2, we have a defect in the plant that is taking 2% of the energy generated and, even so, the specific energy was higher than in the plant in scenario 3, where only variables over which we have no control caused the reduction in generation. Therefore, we must be very careful when using specific energy to compare plants and to decide whether there is any additional loss process taking place.
Global Performance – Performance Ratio (PR)
The most appropriate method for comparing similar plants and quantifying the loss processes that are occurring in our plant is global performance. The overall performance is defined by dividing the amount of energy delivered to the grid by the amount of light energy that reaches the face of the module already converted by the panel's efficiency.
Between the amount of energy that the module converts and the energy delivered to the grid, we will have all loss processes that depend exclusively on design decisions, such as: losses in DC and AC cabling, inverter efficiency and configuration, losses due to optical and thermal effects that are properties of the chosen modules and so on.
The diagram below, generated in the software PVSyst, shows the sources of energy losses of a typical plant: In the case of the figure, for example, our Performance Ratio will be 6692 kWh / 7935 kWh = 0.84. The system has 4.8 kWp, so it has a specific energy of 6692 kWh / 4.8 kWp = 1394 kWh/kWp. To illustrate the difference between Performance Ratio and specific energy, let's repeat the 3 previous scenarios.
- The projected plant has an estimated energy of 1394 kWh/kWp in the first year. Measurements at the end of the plant's first year of operation match expectations. The meteorology was very close to the average used by the software and there are no loss processes that were not modeled. The measured specific energy and performance ratio match the simulation;
- The simulated plant was installed in an atypical meteorological year: the rainfall and cloudy days were lower than average, enabling the capture of over 2% of light energy in the module. In this same plant, there is an assembly defect that generated an additional loss of 2% of energy. Result: 1394 kWh/kWp of specific energy, the same as the plant without defects. However, the performance ratio is different: 2% lower than projected;
- The plant in scenario 1 was installed in an atypical meteorological year: 2% less light energy, and there are no loss processes that have not been modeled in the software. Result: 1470 kWh/kWp and Performance Ratio is maintained.
Table 1. Detection of generation deviations using specific energy and performance ratio
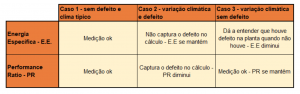 In practice, this means that the performance ratio is somewhat immune to external climatic variations and small differences in the positioning and inclination of the systems, since if there is an increase in the amount of light received, there is a proportional increase in the energy delivered.
By dividing one by the other to arrive at the PR, we cancel the effect of this variation. The performance ratio is an excellent tool for analyzing system losses and can be very useful for detecting problems in the plant, as we will see in the last section of the article. We can also rewrite the performance ratio as in the equation below:
Measurement of IV curve, irradiation and temperature
Measuring the IV curve is the most accurate method for identifying problems in generation, since it is the direct measurement of the electrical characteristics of the modules and is capable of detecting problems in the arrangement of the modules in detail.
The inverters are capable of identifying the general shape of the IV curve, however the IV characteristic of the module is strongly dependent on the irradiation and cell temperature. Without specific irradiation and temperature sensors, we may not capture all loss processes and our generation analysis is incomplete.
We wouldn't know, for example, if the Isc is low because of the amount of light or because of dirt, in the same way that we wouldn't know if the Voc value matches the temperature-corrected datasheet.
The use of sensors to complement the analysis
Of the tools presented, we see that two require extra sensors to be valuable in comparing what was designed with what was realized. To calculate the Performance Ratio we need at least one irradiation sensor.
For an accurate and detailed analysis of the IV curve, in addition to having an inverter with this functionality, we will need the irradiation and cell temperature sensor. Having the data from the extra sensors in hand, we can calculate the performance ratio and even estimate the IV behavior of the module.
With this, in addition to being able to answer the question “Is my plant generating what is expected?” we gain two strong fault detection tools. A performance ratio calculated much lower than projected is indicative of loss processes that were not modeled or that arose due to problems in the products and/or assembly.
A measurement of the IV curve with the defects presented above also informs us of possible failures in the plant. The extra sensors can have other interesting features, such as anemometers to measure wind speed and determine whether a tracker should go to the safety position in a windstorm.
We can also use an ambient temperature sensor to correlate with the module's temperature data or even as a simple record of the operating temperature around the module or inverter. As the inverter can suffer power derating due to temperature, an ambient temperature sensor close to the equipment would solve this concern.
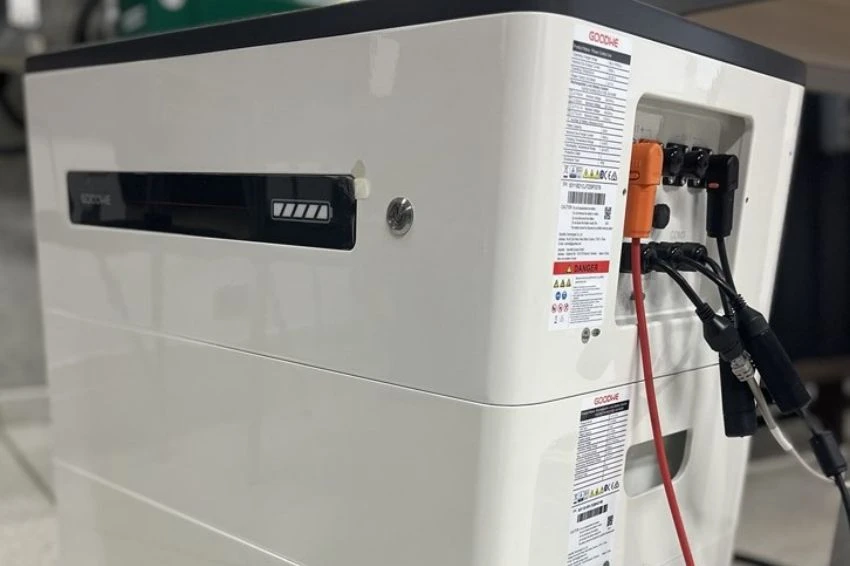
The sensors can be integrated into a plant supervisory system, or even directly into the inverter platform. Some market models already have this sensor aggregation capability and even perform calculations and display data directly on the inverter's standard monitoring platform.


One Response
Articles like this contribute greatly to the technical growth of professionals in the field. I always learn and update myself a lot when I read Canal Solar's technical articles.
The idea of extra external sensors can greatly enrich the analyzes carried out automatically by plant supervisory systems, guiding decision-making and planning for possible preventive and predictive maintenance, before they become failures. Congratulations on the article!!!