With the rapid development of photovoltaic technology from P-type to N-type, the difference in power generation of products with different cell technologies is attracting more and more attention. At present, the mainstream cell technologies are PERC, TOPCon and HJT.
Each of them has its own advantages and disadvantages, but comparative research on power generation has not yet provided a systematic full-life cycle comparison from the perspective of global application scenarios. To this end, the core parameters of the three technologies mentioned above were collected.
Power generation from utility-scale power plants with these three different panel cell technologies was studied over a 25-year life cycle in 21 countries in typical regions with different climate environments around the world evaluated by Risen Energy to create a comparative map of global energy generation gains.
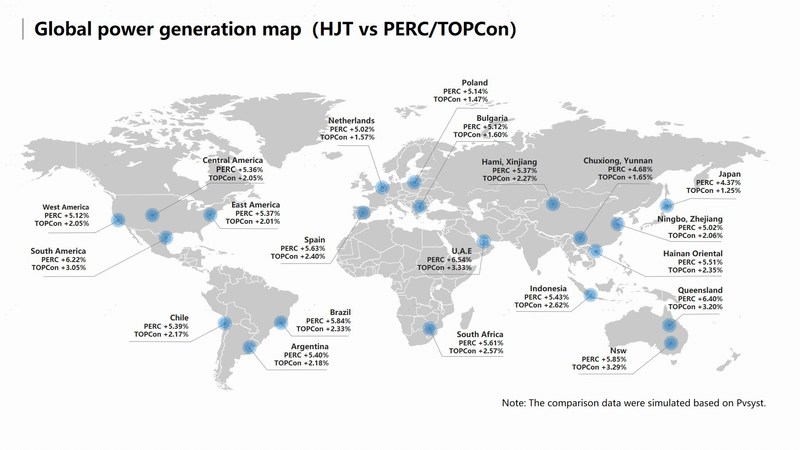
Global Power Generation Gains Map (HJT versus PERC/TOPCon)
Overall, HJT technology products have higher power generation, which is 4,37%-6,54% higher than PERC and 1,25%-3,33% higher than TOPCon. Its power generation performance is more outstanding, especially in regions with high temperature (e.g., the Middle East, Australia, and southern USA).
With 6% higher gain compared to PERC and 3% higher compared to TOPCon. As shown in Figure 1.1.
Technical analysis of modules
Based on the characteristics of the modules, the power generation gap between different cell technologies in each region of the map is mainly caused by three factors: temperature coefficient, bifacial factor and power degradation.
That's why HJT modules can offer higher power generation gains and more stable energy yield for the PV system, with their extremely stable temperature coefficient, higher bifacial factor and higher energy retention.
Extremely stable temperature coefficient
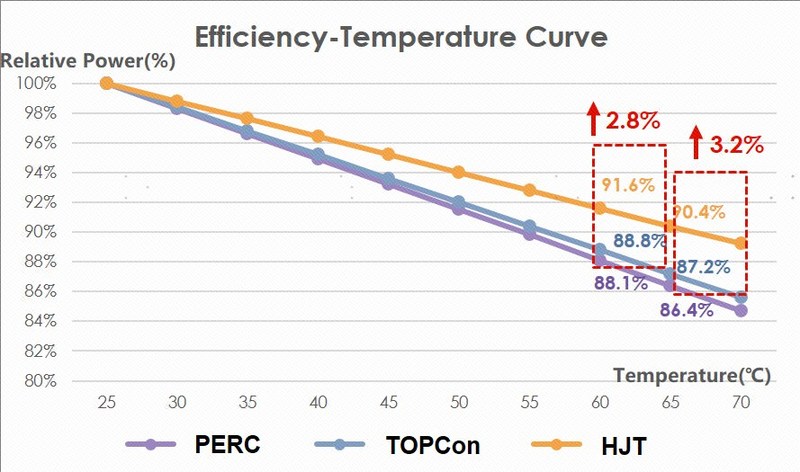
Compared to the power temperature coefficient of -0,35%/°C for PERC and -0,32%/°C for TOPCon, HJT modules have a more stable power temperature coefficient of -0,24%/°C. Which means HJT modules offer lower power degradation compared to PERC and TOPCon modules.
As the module's operating temperature increases, thus reducing the loss of energy generation, this generation gain advantage will occur mainly in the case of high operating environment temperatures, as shown in Figure 2.1.
- At an operating temperature of 60°C, the relative power of HJT modules is 2,8% higher than that of TOPCon modules and 3,5% higher than that of PERC modules;
- At an operating temperature of 65 °C, the relative power of HJT modules is 3,2% higher than that of TOPCon modules and 4% higher than that of PERC modules.
Largest bifacial factor
With a natural symmetrical structure, the HJT cell is inherently a bifacial cell with the highest bifacial factor technology at present. In the same application scenario, the higher the bifacial factor, the higher the back-end power generation gain.
The bifacial factor of HJT modules is approximately 85%, which is about 15% higher than that of PERC modules and approximately 5% higher than that of TOPCon modules, as shown in Table 2.1.
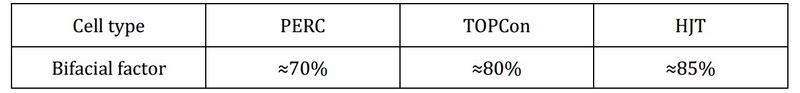
In the same utility-scale ground-mounted power plant application scenario, the higher bifacial factor of HJT modules provides high power generation gain compared to PERC and TOPCon modules.
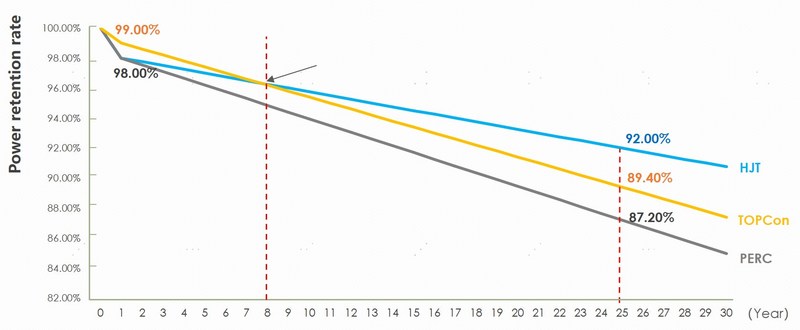
Greater energy retention
Based on the power degradation curves of the three different cell technologies, it is clear that by the end of last year, the power retention rate of HJT modules is 92%. While that of PERC modules is 87,2% and that of TOPCon modules is 89,4%.
This means that HJT products offer better energy production retention throughout the life cycle of utility-scale power plants. This can result in more stable and relatively higher power generation, as shown in Figure 2.3.
As the results discussed above were evaluated with the current 2% degradation in the first year, the power generation gain advantage will be more notable, as improving cell and module encapsulation technology and materials can lead to less degradation of HJT products in the first year.
Above we have presented a brief analysis of the performance of HJT cells and modules. However, what are the main factors that affect the power generation of the modules? To what extent is the impact significant? Risen Energy attempted to perform a further analysis with PVSYST.
Analysis with PVSYST
In terms of influencing factors for power generation, typical high and low temperature application scenarios will be selected for analysis respectively.
Low temperature application scenarios
Harbin City is chosen as a typical example of low-temperature application scenario, which is located near 45,9°N with an average annual temperature of 4,7°C and a total horizontal irradiation of 1.347 KWh/m2.
The power plant was designed with a CD/AC ratio of 1,25 and installed capacity of 4 MW (with slight variations in the actual design), using fixed support with ideal tilt angle and suitable string inverters.
Until year 25, the power generation gain of TOPCon modules is 3,94%, and the power generation gain of HJT is even greater, 7,73%, compared to the power generation of PERC, as shown in Table 3.1.
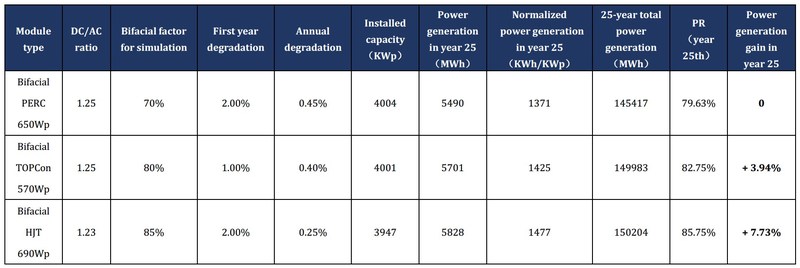
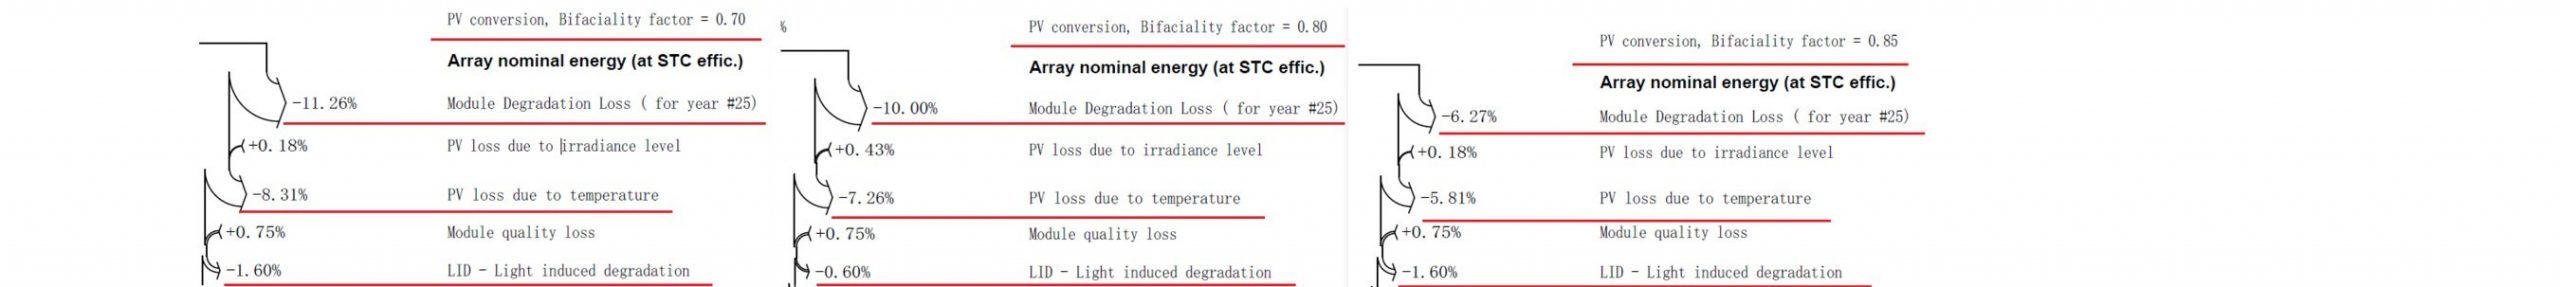
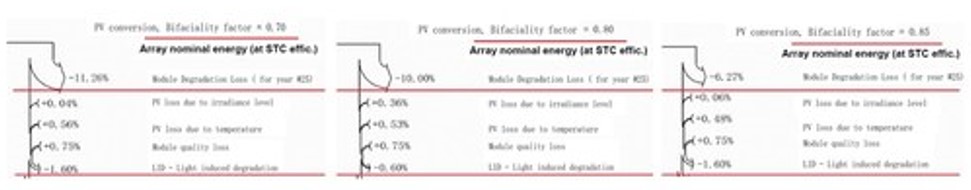
According to the loss comparison, the most important factor affecting power generation in low-temperature applications is power degradation. At the end of year 25, the power degradation is 12,86% (1,6% + 11,26%) for PERC modules, 10,6% (0,6% + 10%) for TOPCon modules, and 7,87% (1,6% + 6,27%) for HJT modules. See Figure 3.1.
High temperature application scenarios
Abu Dhabi in the Middle East is chosen as a typical example of a high-temperature application scenario, which is located near 24,4°N with an average annual temperature of 28,5°C and a total horizontal irradiation of 2.015,1 KWh/m2.
The power plant is designed with a DC/AC ratio of 1,05 and an installed capacity of 4 MW (with slight variations from the actual design), applying the optimal tilt angle for fixed supports and suitable string inverters. By year 25, the power generation gain of TOPCon modules is 4,52%, and the power generation gain of HJT is even higher, 9,67%, compared to the power generation of PERC, as shown in Table 3.2.
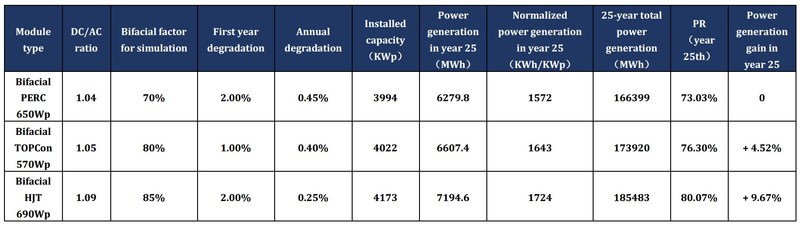
According to the loss comparison chart, in addition to power degradation, operating temperature loss is another important factor that affects power generation in high temperature scenarios.
At the end of last year, the energy degradation of PERC modules is 12,86% (1,6% + 11,26%), while that of TOPCon modules is 10,6% (0,6% + 10% ) and that of HJT modules is 7,87% (1,6% + 6,27%); the operating temperature loss of PERC modules is 8,31%, while that of TOPCon modules is 7,26% and that of HJT modules is 5,81%, as shown in Figure 3.2.
The above analysis shows that in low-temperature application scenarios, module power degradation is one of the main factors affecting the power generation of the product. And in high-temperature application scenarios, operating temperature is another important factor.
Due to the extremely stable temperature coefficient, higher bifacial factor and higher energy retention of HJT modules, the power generation gain advantage of HJT is obvious in both high temperature and low temperature areas. HJT also shows relatively high power generation gain, which provides higher power generation gain and more stable power yield for the PV system.