
The Brazilian photovoltaic sector has become accustomed to projecting energy generation based on stable historical averages and deterministic assumptions.
However, the emergence of the phenomenon known as Super El Niño (or Historic El Niño) has brought a new reality to the solar energy market in Brazil: a scenario marked by severe thermal anomalies, significant changes in radiation patterns, and a drastic increase in the frequency of extreme weather events.
While El Niño significantly alters the distribution of GHI (global horizontal irradiance) and DNI (direct normal) in different regions of the country, favoring certain areas with clear skies and penalizing others with atypical cloudiness, it also brings a package of operational stressors that can drastically compromise the Performance Ratio (PR), the useful life of assets, and the bankability of projects.
How Extreme Super El Niño Events Affect PV Operations
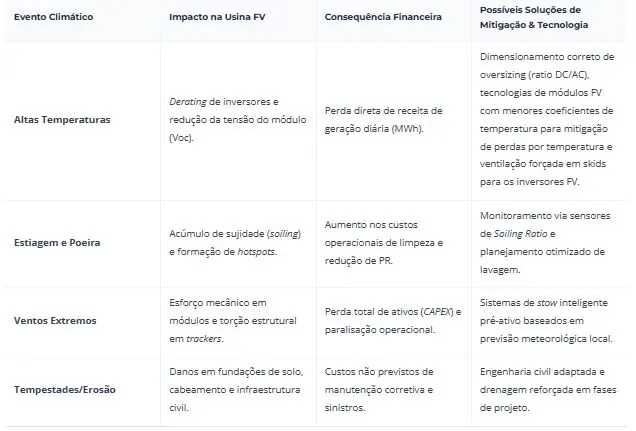
The impacts of a climate event of this magnitude go far beyond common seasonal variations. Below, the main drivers of degradation in the performance and technical integrity of power plants are detailed:
1. Excessive Heat Waves and Heat Loss
The substantial increase in ambient temperatures raises the operating temperature of photovoltaic cells well above the Standard Test Conditions (STC – 25 °C) parameters.
- Voltage Drop (Voc): The module's temperature coefficient acts by directly reducing the open-circuit voltage, which can lead to daily generation losses exceeding 8% to 12% during peak times.
- Inverter Derating: High temperatures in the inverter room or on the transformer skids trigger self-protective mechanisms (thermal derating), cutting off the plant's power output precisely during periods of highest solar irradiance.
2. Severe Drought and Accelerated Soil Deposition (Soiling)
The prolonged reduction in rainfall in regions with high solar concentration, such as the Northeast and North of the country, interrupts the natural washing cycle of the solar panels.
- Increased Soiling Rate: The continuous accumulation of dust and particulate matter (PM2.5 and PM10) reduces the transmittance of the glass, potentially leading to cumulative daily losses exceeding 0.5% per day if no operational intervention is taken.
- Hotspot Formation: The heterogeneous deposition of dirt associated with excrement or abrasive debris causes partial shading of cells, inducing constant activation of bypass diodes and accelerating localized thermal degradation.
3. Gales and Structural Damage
The atmospheric dynamics altered by Super El Niño intensify wind gusts and severe convective storms.
- Mechanical Fatigue in Trackers: Single-axis tracking structures are exposed to aeroelastic instability phenomena (such as torsional flutter).
- Failure in the Defense Position (Stow Position): If the automation system or gust response algorithms fail or are slow to act, the wind can cause table twisting, module tearing, and even total mechanical collapse of the array.
4. Torrential Rains and Erosion
In regions where El Niño intensifies concentrated rainfall, the high volume of rain in short periods of time poses serious risks to civil infrastructure.
- Erosion and Flooding: Large-scale, utility-scale power plants suffer from siltation of drainage channels, degradation of foundation piles, and the risk of submersion of electrical cables and improperly sealed junction boxes.
Matrix of Impacts and Mitigation Strategies

- The End of the TMY Era? The Need for Probabilistic Risk Assessments
Historically, financial feasibility studies for photovoltaic projects have been based on the concept of TMY (Typical Meteorological Year). The TMY is constructed by combining "average" months from long historical series to create a representative synthetic year.
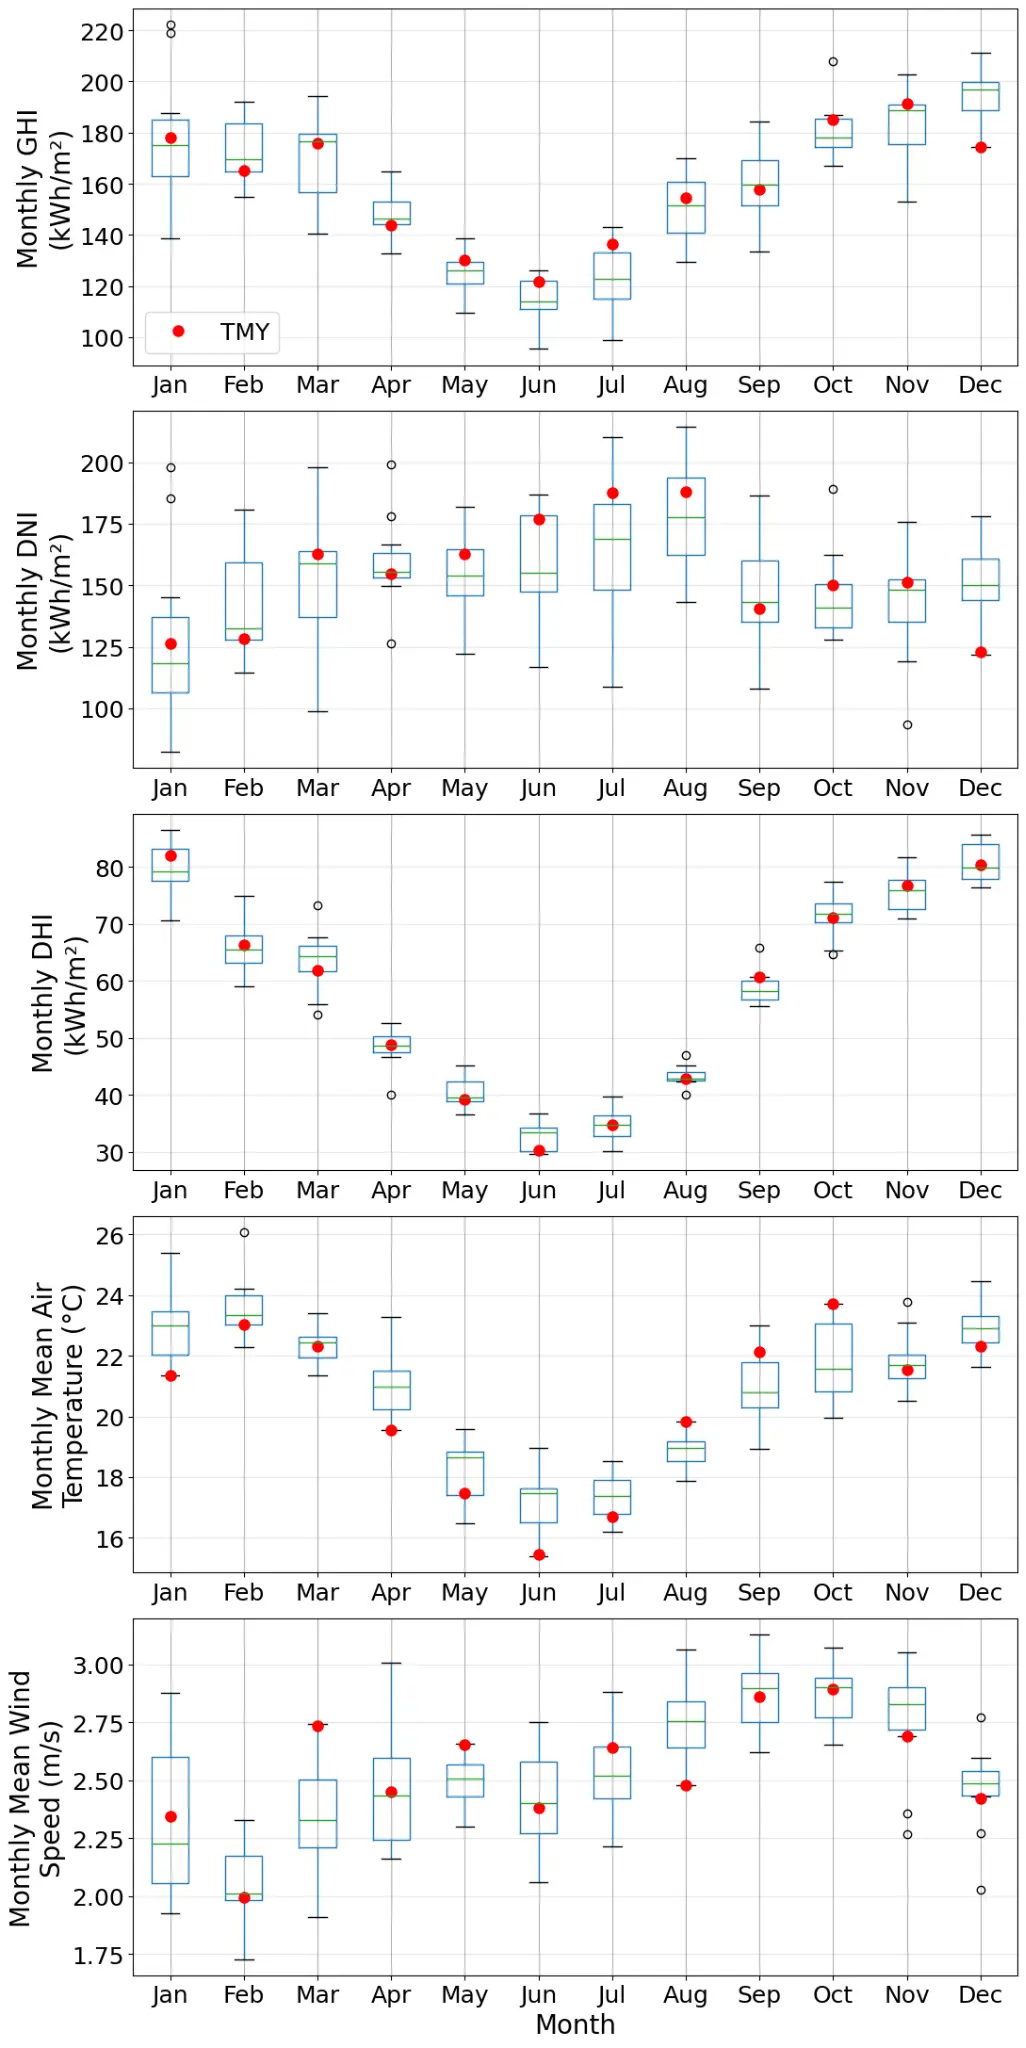
Figure: Comparison of long-term historical series of climate data in relation to data from the TMY, showing that the TMY is not sufficient to provide an adequate probabilistic risk assessment study, taking into account historical extreme scenarios.
However, TMY, by definition, smooths and hides extreme events. It fails to capture the interannual variability brought about by phenomena such as Super El Niño. Relying exclusively on deterministic P50 simulations based on TMY in times of accelerated climate change is to assume an invisible financial risk that can compromise the project's debt service coverage ratio (DSCR).
How to protect your investment?
To mitigate risks and protect invested capital, the sector needs to evolve towards advanced risk assessment metrics and methodologies.
- Incorporation of Aging Time Series from Satellite Sources: The use of satellite databases with records spanning more than two decades allows for increased reliability in photovoltaic feasibility analyses, consolidating simulations supported by the long-term meteorological history of commercial and open platforms.
- Use of Plausible Meteorological Years (PMY): Feasibility analyses should integrate stochastic simulations that consider scenarios of dry and extremely hot years, allowing for an understanding of cash flow behavior under adverse conditions.
- Pxx Scenarios for Financial Sizing: Projecting bankability considering conservative probabilistic scenarios ensures that the plant continues to honor financial commitments even during a prolonged Super El Niño event.
- Transparent Quantification of Uncertainty: Integrating the uncertainty of solar resources into the financial model reduces the cost of capital with banks and investors, increasing the project's credibility.
Intelligent Generation and Weather Forecasting Solutions
Mitigating the impacts of Super El Niño doesn't just occur during the project development phase, but also in the day-to-day operations and maintenance (O&M). Adopting advanced digital tools is the key differentiator for ensuring asset resilience.
- Multi-Horizon Generation Forecasting (Physics + AI): Combining numerical weather prediction (NWP) models with machine learning and artificial intelligence-based models (such as Gradient Boosting or neural networks for time series) allows for forecasting energy generation over very short-term (intraday) and short-term (day-ahead) horizons.
- Early Management of Extreme Events: Predictive models integrated into the plant's control systems (SCADA) can issue early warnings of severe gales or storms, proactively activating the defense mode (stow position) of the trackers minutes before the arrival of the wind front, preventing structural catastrophes.
- Decision Making in System Operation and Dispatch: With accurate forecasts of generation and temperature variation, power plant operators in the free market (ACL) can optimize their energy supply strategies, reducing penalties for imbalances caused by sudden fluctuations in solar resources.
Conclusion: Climate Risk Must Be Addressed with Data Intelligence
The Super El Niño is a stark reminder that solar resources and climate are not static variables. As extreme events become more frequent and intense, the financial viability of photovoltaic projects will depend directly on the ability of engineers, developers, and investors to accurately measure risk.
Investing in probabilistic risk studies during the development phase and in intelligent forecasting and monitoring platforms during operation is not an additional cost, but rather an indispensable insurance policy. It's the strategy that guarantees the preservation of ROI, prevents multimillion-dollar material losses, and elevates the Brazilian solar sector to a new level of maturity and resilience.
The opinions and information expressed are the sole responsibility of the author and do not necessarily represent the official position of the author. Canal Solar.

Comments
Comments are moderated before publication.Comments should be respectful and contribute to a healthy debate. Offensive comments may be removed. The opinions expressed here are those of the authors and do not necessarily reflect the views of the author. Canal Solar.