
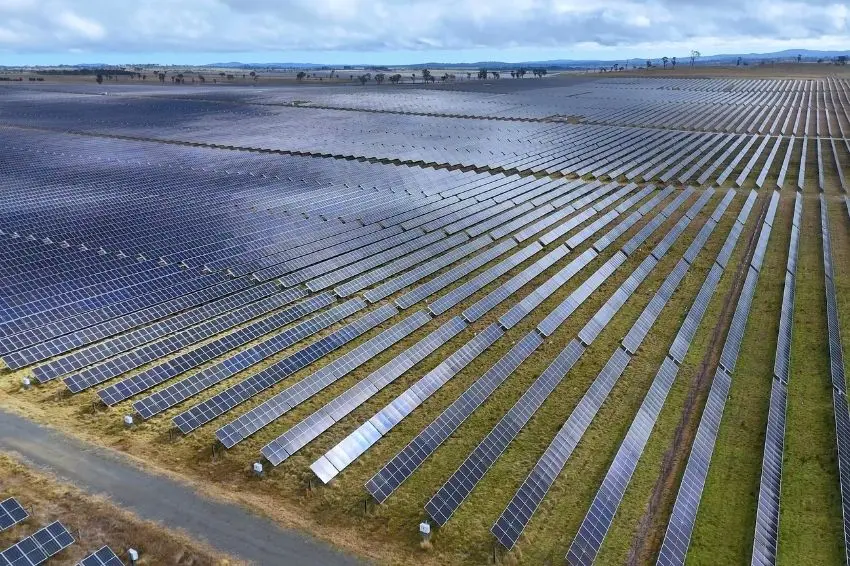
Data from the ONS (National System Operator) indicates that the curtailment The construction of wind and solar power plants grew by approximately 21% between January and August 2026, compared to the same period last year, according to an analysis conducted by... Canal Solar.
Unrealized energy generation from the two sources, called GNRa, increased from an average of 3.429 MW in 2025 to an average of 4.122 MW this year.
In practice, this represents an additional 693 MW on average this year that could have been produced but was cut due to some system restriction. The data shows that the increase occurred even without an increase in the generation actually delivered.
The sum of verified generation and cut-off energy increased from an average of 19.055 MW to an average of 19.735 MW. Meanwhile, actual generation decreased slightly, from an average of 15.626 MW to an average of 15.612 MW.
As a result, the share of unused energy increased from 18% in 2025 to 20,9% of the potential generation of the analyzed power plants in 2026.
Energy restrictions drive the increase.
The growth of curtailment This was caused by restrictions classified as energy-related. This type of cut generally occurs when there is excess supply relative to demand or a lack of capacity to distribute all available production.
Cuts due to energy consumption jumped from an average of 1.706 MW to an average of 2.837 MW. The increase was 66,3%, or an average of 1.131 MW in just one year. This type of production will represent 14,4% of potential generation in 2026, compared to 9% in the same period of 2025.
Conversely, restrictions related to reliability fell by 17,8%, from an average of 982 MW to an average of 807 MW. The share of this type of cut decreased from 5,2% to 4,1%.
There was also a reduction in losses due to external unavailability, which went from an average of 741 MW to an average of 478 MW. The decrease was 35,5%.
External unavailability occurs when electrical equipment necessary for power outages is out of operation, while reliability cuts are made to prevent overloads and preserve system safety.
Even with the reduction in these two modalities, the increase in energy restrictions was enough to lead to... curtailment at the highest level.
The Northeast region accounts for more than 80% of the cuts.
The Northeast continued to be the most affected region. The energy not generated in the subsystem increased from an average of 2.830 MW to an average of 3.403 MW, a growth of 20,2%.
This means that the Northeast concentrated about 83% of all of it. curtailment registered in the country until August 2026. In the Southeast, GNRa grew 11,2%, from an average of 563 MW to an average of 626 MW.
The South showed the largest percentage increase, but on a small base. Cuts increased from an average of 15 MW to an average of 70 MW. In the North, they increased from an average of 20 MW to an average of 23 MW.
Cuts increase between wind and solar power.
Wind farms continued to account for the largest volume of ungenerated energy. curtailment The output from the source increased from an average of 2.299 MW to an average of 2.753 MW, a rise of 19,7%.
Power cuts for energy reasons in wind power increased by 56,9%, from an average of 1.071 MW to an average of 1.680 MW. Meanwhile, reliability constraints remained practically stable, going from an average of 690 MW to an average of 710 MW.
Losses due to external unavailability decreased from an average of 538 MW to an average of 363 MW, a drop of 32,5%. Among photovoltaic solar plants, the energy not generated increased by 21,3%, from an average of 1.129 MW to an average of 1.370 MW.
Again, the energy ratio explains the result. Cuts in this category went from an average of 634 MW to an average of 1.157 MW, an increase of 82,5%.
At the same time, solar reliability constraints fell from an average of 292 MW to approximately 97 MW. Outages due to external unavailability decreased from an average of 203 MW to approximately 115 MW.
The numbers reinforce the profile of curtailment In Brazil, cuts linked to reliability and external unavailability have diminished, while energy constraints continue to grow.
all the content of Canal Solar is protected by copyright law, and partial or total reproduction of this site in any medium is expressly prohibited. If you are interested in collaborating or reusing part of our material, please contact us by email: redacao@canalsolar.com.br.


Comments
Comments are moderated before publication.Comments should be respectful and contribute to a healthy debate. Offensive comments may be removed. The opinions expressed here are those of the authors and do not necessarily reflect the views of the author. Canal Solar.