
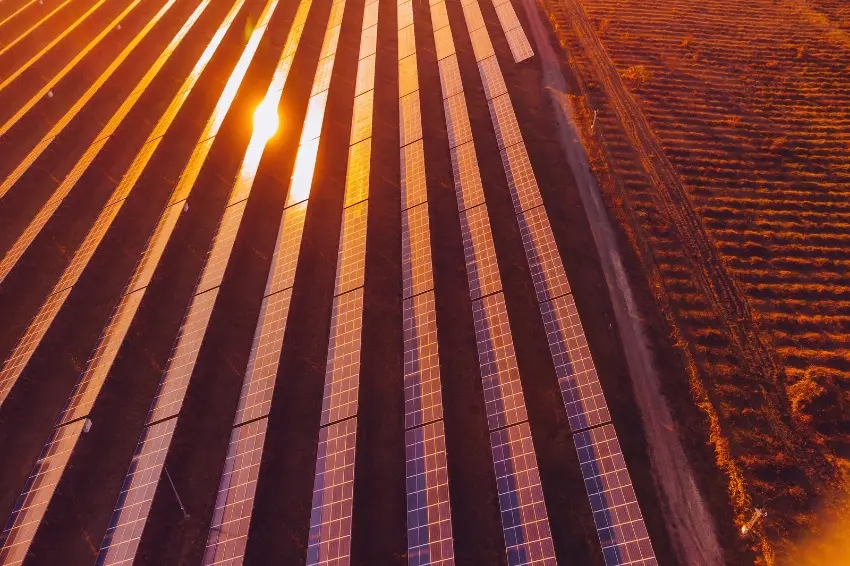
At 12:01 PM this Sunday, August 23rd, the solar generation curve published by ONS (National System Operator) registered 35.124,5 MW. At virtually the same time, at 12:00 PM, the load of the (National Interconnected System) was at 70.978,5 MW.
The relationship between the two numbers is striking: at that time, solar generation accounted for approximately 49,5% of the SIN's load.
At 15:18 PM, the load had decreased to 66.437,9 MW, while solar generation was still delivering 25.823,8 MW, about 38,9% of the load. In the same snapshot of the system, there were 27.125,3 MW of hydroelectric generation, 7.875,3 MW of thermal generation, 4.701,7 MW of wind generation, and 2.006,5 MW of nuclear generation.
These figures help explain why, this Sunday, the ONS (National System Operator) activated the Energy Surplus Management Plan in the Distribution Network again, for the second time in 2026.
More than just an operational event, August 23rd offers a good snapshot of the transformation that has already taken place in the Brazilian electrical system.
For many years, the discussion has focused on expanding the supply of renewable energy. Installed capacity has grown, solar generation has scaled up, and millions of consumers have also started producing electricity.
Now another need arises: to create conditions so that this energy is absorbed and used during the times when it is available, while preserving the safety of the system.
Balance needs to happen at every moment. An electrical system needs to maintain a constant balance between production and consumption.
On a Sunday with lower load and high solar incidence, the combination can create periods where there is more generation available than the system can accommodate.
Under these circumstances, the ONS (National System Operator) first reduces the sources over which it has direct control. When these resources have already been used and there is still a need to reduce generation, the Surplus Management Plan comes into play.
According to information released this Sunday, the action took place during the period of highest photovoltaic production, between late morning and early afternoon. The issue goes beyond the total amount of energy available in the country.
What matters is where this energy is being produced, at what time, how much of it can be controlled, and the system's capacity to respond to variations in generation and consumption.
This is one of the central points of electrical operation in a grid with an increasing presence of variable sources. Solar generation has already changed the Brazilian curve.
The data presented by ONS itself needs to be interpreted taking into account the methodology used by the Operator.
Since March 2021, the Load and Generation page has used the concept of global load, incorporating generation from unsupervised power plants. Since April 2023, the ONS (National System Operator) has also included an estimate of micro and mini-distributed generation (MMGD) in the data presented to the public.
Therefore, the curve we observed this Sunday seeks to represent a system in which distributed generation already has considerable weight. This movement has gained momentum.
By the end of 2025, Brazilian micro and mini-distributed generation already had approximately 45 GW of installed capacity, according to data from the Energy Research Company. In the first half of 2026, information released by the Ministry of Mines and Energy (MME) indicated that this capacity had exceeded 50 GW.
Photovoltaic solar energy is predominant. The effect of this expansion is directly reflected in the load curve. During peak sunshine hours, a significant portion of consumption is supplied by solar generation, including systems installed near or within the consumer units themselves.
For the centralized system, the demand to be met by other sources decreases sharply during the day. The opposite occurs in the late afternoon.
Photovoltaic production is falling rapidly, while consumption remains high or is rising again. Other sources then need to increase their production in a relatively short time.
This is the dynamic known internationally as the "duck curve," which takes on its own characteristics in Brazil because of the composition of our energy matrix, the large share of hydroelectric power, and the speed at which distributed generation has advanced.
The problem, therefore, lies less in the annual amount of energy and more in the ability to manage power, schedule, and flexibility.
Having surplus energy doesn't mean you can shut down any power plant. A question naturally arises when solar generation is restricted:
If there is excess energy, why do other power plants continue generating? Because the operation of the electrical system involves functions that go far beyond the production of megawatt-hours.
Hydropower plants have operational, environmental, and hydraulic limitations. Thermal power plants may have inflexibilities or minimum generation limits. Nuclear power plants have their own operating characteristics.
Furthermore, certain synchronous units contribute to the stability of the system, assisting in frequency and voltage control, responding to disturbances, and providing other essential services to keep the National Interconnected System (SIN) safe.
Studies conducted by ONS itself show that an excessive reduction in synchronous generation, in certain scenarios of very low net load, can produce additional difficulties for operation. Therefore, simply talking about "surplus energy" oversimplifies what is happening.
There is available power, but there are also electrical constraints, operational limits, and safety requirements that must be respected simultaneously.
MMGD and Type III plants: an important difference. It is also necessary to separate two concepts that, in some analyses of this episode, appear mixed up.
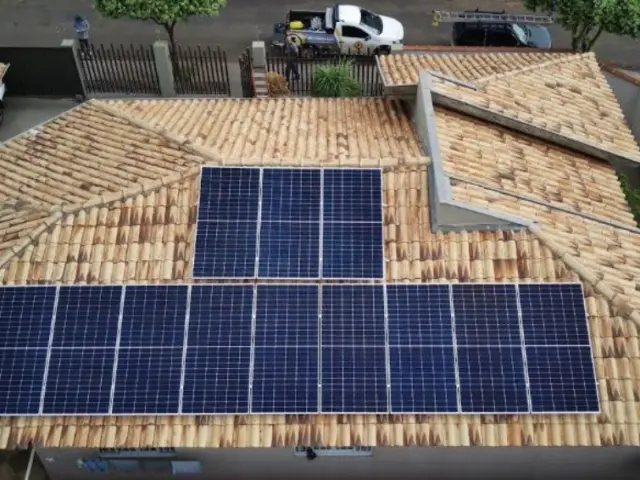
The expansion of micro and mini-distributed generation strongly contributes to reducing net load during peak solar production hours.
But this does not mean that the ONS (National System Operator) is ordering the shutdown of solar panels installed in Brazilian homes.
In the current phase of the Surplus Management Plan, the action covers power plants classified as Type III, connected outside the Basic Grid and without dispatch or centralized scheduling by the ONS (National System Operator).
These facilities have no direct operational relationship with the Operator. For this reason, when there is a need to reduce generation, coordination must be carried out with the distributors.
The distinction is relevant. MMGD helps create the low net load conditions that make certain periods more challenging for the system. The emergency mechanism used today, in turn, acts on a specific set of facilities that can be operationally reached by the distributors.
This point also anticipates a discussion we will have in the future: how to increase visibility and coordination capacity regarding increasingly distributed energy resources.
The event was predicted in ONS studies. What happened this Sunday was not unexpected. In the PAR/PEL 2025, referring to the 2026–2030 cycle, ONS had already analyzed the impacts of the expansion of distributed generation and variable renewables on the system's operation.
In the scenarios evaluated for the period between 2026 and 2029, the Operator identified situations with the potential for loss of controllability of the SIN (National Interconnected System) if additional measures were not adopted.
In one of the analyses, considering a specific thermal generation pattern, 39 days with critical conditions and 101 hours with potential surplus generation were identified.
In the most severe case studied, the need for reduction could reach approximately 4.900 MW. Studies also indicate a higher concentration of these episodes between approximately 9 am and 16 pm, especially on weekends and holidays.
The coincidence is quite clear: lower consumption, high photovoltaic production, and less operating space for other sources.
Sunday, August 23rd, perfectly exemplified this type of condition. The next strategic investment is called flexibility.
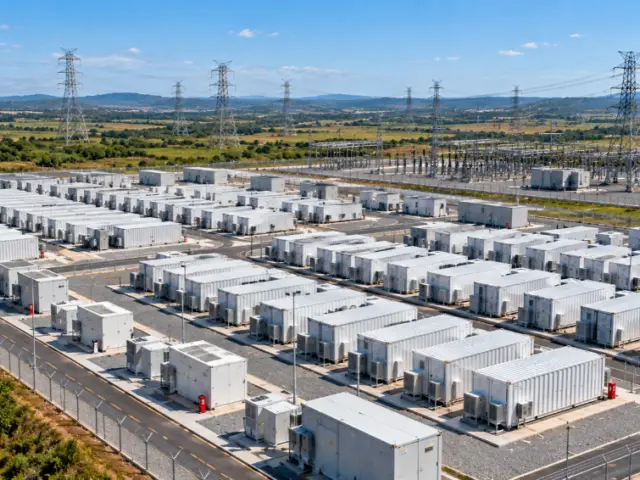
If Brazil is already able to produce more than 35 GW of solar energy around midday, it makes sense to discuss how to better utilize this availability throughout the following hours. Storage is part of that answer.
Batteries can absorb energy during periods of high generation and return it to the system when solar production begins to decline.
But the flexibility needed by the SIN (Brazilian Interconnected System) will hardly come from a single technology. It involves storage, demand response, greater flexibility of power plants, modernization of networks, voltage and frequency control resources, active management of distributed generation, and new consumption patterns.
There is also an economic opportunity that deserves attention. A system with high energy availability during certain hours should encourage activities capable of shifting consumption to those periods.
Charging electric vehicles, thermal storage, flexible industrial processes, hydrogen production, and other manageable loads can help bridge the gap between demand and generation availability.
This requires appropriate economic signals. The way we charge for, contract for, and price electricity will increasingly need to align with the time of day when it is actually available.
However, studies by the ONS (National System Operator) also demonstrate that simply increasing consumption during the day does not fully solve the problem. In a sensitivity test conducted by the Operator, the inclusion of approximately 4 GW of new large consumers reduced the total average curtailment by less than 800 MW in the scenarios evaluated.
The answer, therefore, will need to combine different resources. There is a regulatory agenda ahead. In November 2025, the ANEEL published Order No. 3.431, establishing procedures related to the implementation of the Surplus Management Plan and determining that selected distributors should structure mechanisms to comply with operational directives.
The order also stipulated that, after each activation of the plan, the ONS (National System Operator) must submit a technical report to the Agency within 30 days, detailing the conditions encountered and the results of the operation.
Therefore, any statement at this time about the exact amount of megawatts effectively restricted on August 23 would be premature.
This information should appear in the operation report. It will be important to know it, but there is another indicator that I consider even more relevant: the frequency with which this mechanism will need to be activated going forward.
An emergency procedure is created for exceptional conditions. When it begins to be used repeatedly, it also starts to signal that the system's structure has changed. What does August 23rd teach us?
It would be a mistake to turn this episode into an argument against solar power generation. The numbers clearly show the extent of the progress achieved by this energy source in Brazil.
In a short time, we built a photovoltaic park capable of representing, at certain times, a very significant portion of the country's energy load. The next challenge is to make better use of this energy.
This involves investments, operational planning, regulatory modernization, storage, smarter grids, and mechanisms capable of bringing production and consumption closer together.
Up until now, much of Brazil's energy transition has been measured by the number of megawatts installed. From now on, we will also need to observe how much of this generation can be integrated efficiently, safely, and economically throughout the 24 hours of the day. Sunday's curve makes this challenge visible.
At 12:01 PM, there were over 35 GW of solar generation in the system. The next step is to build an electricity sector capable of better utilizing each of them.
The opinions and information expressed are the sole responsibility of the author and do not necessarily represent the official position of the author. Canal Solar.

Comments
Comments are moderated before publication.Comments should be respectful and contribute to a healthy debate. Offensive comments may be removed. The opinions expressed here are those of the authors and do not necessarily reflect the views of the author. Canal Solar.