

With the collaboration of Helder Sousa
Time-of-use pricing is an essential and indispensable regulatory tool for flattening the load curve of the electricity system, reducing cross-subsidies, and mitigating the need for billions of dollars in network infrastructure investments.
On the other hand, the system for new models of the White Tariff being discussed by the National Electric Energy Agency (Aneel) may alter costs for some consumers. To reach these conclusions, this study analyzes the evolution, challenges, and perspectives of this modality based on the possible hypotheses of ongoing remodeling.
The voluntary (opt-in) tariff model, launched in 2018, has proven ineffective, reaching only 0,09% of the eligible market by 2025. This performance is attributed to ineffective communication and consumer engagement, and to regulatory restrictions in the model, which prioritized revenue neutrality for distributors at the expense of economic incentives for consumers, weakening the hourly signaling of network usage costs (TUSD Transport).
Faced with this stagnation and the emergence of new systemic phenomena — such as the oversupply of solar energy in the middle of the day, associated with the "Duck Curve" —, Aneel is studying the application of the automatic and compulsory transition of large low-voltage consumers to the new tariff later this year.
To assess the impacts of these measures, the study presents simulations with a "hypothetical" "reformulated" White Tariff, calibrated to directly reflect the marginal costs of capacity.
The results point to a clear division of effects: assuming inertia in consumption habits, the model largely benefits subgroups B2 (rural) and B3 (commercial), but tends to penalize part of subgroup B1 (residential). For 53,5% of the B1 market of the analyzed distributor, a weighted average increase of 20,6% is projected in the transport component of the tariff, while the remaining 46,5% could see an average reduction of 8,3%.
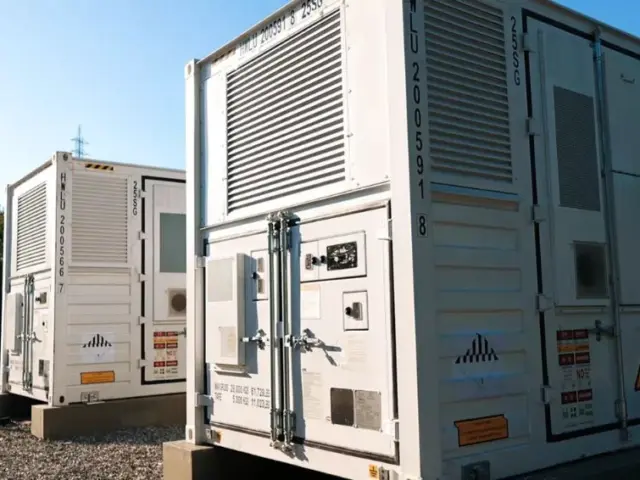
The study also highlights that the advancement of new technologies — such as battery-based energy storage systems (BESS), electric vehicles, and hybrid inverters — has the potential to break this behavioral inertia, allowing consumers to actively manage their demand and transform the risk of price increases into significant cost reductions.
- White Tariff
Economic signaling for low-voltage electricity consumers isn't exactly new. In practice, the topic is reminiscent of unfinished projects that become outdated even before completion: it's the old Yellow Tariff, conceived in 1985, which, after years of waiting to be implemented, ended up "fading" and giving rise to the White Tariff in 2016.
Aneel Normative Resolution No. 733/2016 (later compiled in Normative Resolution No. 1.000/2021) established the commercial rules for application and the schedule for consumer adoption, beginning on January 1, 2018.
The spontaneous adoption of this modality by eligible market participants, in terms of energy consumed, was only 0,09% (2025 data), which shows that, in practice, the model did not reach its target audience and performed well below expectations.
To understand what may have occurred, it is necessary to understand the purpose of this tariff modality. The White Tariff was designed to signal to consumers the hourly costs associated with the provision of the energy transmission service in the distribution network – the TUSD Transport, one of the four parts of the TUSD, as shown in the following figure.

It is important to highlight that, whatever economic signal is introduced into the TUSD (Transmission System Usage Tariff) through the Transportation component, it tends to be dampened — or “sealed in,” as it is said in the sector — by the weight of the other tariff components. This occurs because the Application Tariff is determined by the sum of all the TUSD components — not just the Transportation TUSD — and the Energy Tariff (TE). To give an idea, for consumers connected at low voltage, the charges and the TE can represent more than 64% of the final tariff, without even considering the impact of the tariff flags.

The fact is that the White Tariff is not a model designed to necessarily lower—or even keep the electricity bill the same—but to better reflect the hourly costs that consumers actually impose on the system. Therefore, it is expected that, within the universe of eligible consumers, some will be more responsible than others for the TRANSPORT costs incurred on the grid, based on their consumption profile throughout the day.
By understanding these costs, largely associated with investments, operation, and maintenance of energy transmission assets, consumers would be able to respond to the signal from regulated prices (tariffs), adjusting their consumption habits and equipment usage accordingly. As a result, they could reduce expenses by shifting some consumption to cheaper hours or paying prices more in line with the TRANSPORTATION costs that their usage profile imposes on the system.
For this mechanism to work, however, adherence to the White Tariff — as has been the case since 1985 with the Blue and Green time-of-use tariffs for consumers served at medium and high voltage — would need to be mandatory, not optional. After all, it is unlikely that a consumer will, of their own free will, choose to migrate to a tariff that implies an increase in their bill.
Furthermore, it is essential to establish an effective communication channel with the consumer, capable of making their energy consumption habits visible and tariff signals understandable. As William Thomson (Lord Kelvin) summarized, "what cannot be measured cannot be improved." Ultimately, how can we expect consumers to make decisions about their hourly consumption habits if they do not have access—clearly and promptly—to their own data?
Even for the few consumers who have been willing to switch to the White Tariff under the current rules, communication remains difficult. Figure 3 illustrates how billing data for this modality is typically presented in a practical case, although the interfaces may vary depending on each distributor's system.

You don't need to be an expert to see that the communication model used to present the customer's billing in the example has limitations:
- The bill presents the unit prices in a dense list of text. A simple comparative graph could show that the kWh during "Peak" hours is almost three times more expensive than during "Off-Peak" hours.
- For consumers looking to save money, the technical distinction between TUSD and TE is irrelevant and confusing; after all, what needs to be reported is the total cost per kWh to be effectively paid.
- The invoice mentions "PEAK," "INTERMEDIATE," and "OFF-PEAK," but does not indicate the times when these periods occur (e.g., in the case of Enel SP, Peak Hours are from 17:30 PM to 20:30 PM).
- The historical data only shows the total monthly consumption. For a consumer subject to the White Tariff, the most important historical data would be the composition of consumption, describing, for example, how much energy was consumed each month during the different tariff periods.
1.1 Usage habits
The tariff calculation model considers, for each distributor, dozens of typical usage profiles (load curves) segregated by consumption classes — commercial, industrial, residential, rural, public service, and public lighting. This approach seeks to incorporate regional specificities related to consumption habits, network usage patterns, and equipment ownership into the tariff calculation.


The three previous figures present 15 low-voltage load curves used in the calculation of Cemig's tariff structure in the 2023 tariff review process for the residential class, adjusted to the billed energy.
The graphs show a high degree of heterogeneity in demand profiles: from curves with virtually constant demand throughout the 24 hours to those with very pronounced power peaks distributed across different time windows. Although most concentrate their highest consumption during the night (between 18 pm and 22 pm), unique behaviors are also identified, with isolated peaks in the early morning, morning, or afternoon, highlighting the diversity in how the electricity grid is used throughout the day.

The typical usage profiles representative of Cemig's commercial consumer units (subgroup B3) presented in Figure 7 indicate that, during the day, the infrastructure serving these establishments operates continuously. This behavior reflects the routine of street shops, offices, bank branches, and other services, supported by internal lighting, computer use, and, above all, the virtually uninterrupted operation of air conditioning during the hottest period of the day.
At the end of the workday, retail sales significantly reduce their demand precisely when residential units (subgroup B1) begin to increase consumption by activating their appliances. Between 20 PM and 7 AM the following day, almost all retail curves remain close to the base of the graph. There are slight exceptions—possibly associated with restaurants, bars, and other nighttime activities—but their weight is negligible when compared to the volume observed during the daytime period.
Since most commercial consumption at Cemig occurs before 18 PM, these consumers spend the day predominantly during off-peak hours and reduce their load before the most expensive period. In other words, they wouldn't need to change their habits to benefit from the White Tariff: their own operational routine already positions them to capture significant discounts, as they contribute little to the distributor's peak nighttime stress.

Figure 8 presents the typical curves of Subgroup B2 (Rural). A significant heterogeneity of profiles is observed, with distinct implications for hourly pricing:
- "Villain" at the peak (curve 10): exhibits a significant peak around 18 PM, characteristic of rural residential consumption (agricultural villages and farm headquarters), possibly associated with loads activated in the early evening (poultry farm lighting, heating, and pumps). This group would tend to be heavily penalized by a time-of-use tariff with a high peak (for example, between 18 PM and 21 PM).
- The "darling" of the time-of-use tariff (curve 5): concentrates very high consumption in the early morning hours, with a sharp drop during the day. This is the classic profile of nighttime irrigation, which already takes advantage of lower energy costs for the system and, additionally, reduces losses due to evaporation. It is a naturally optimized consumption pattern and, therefore, tends to benefit greatly from a well-designed time-of-use tariff.
- Single-shift agribusiness (curves 7 and 8): exhibits intense activity in the morning and afternoon (e.g., grain processing, mills, flour mills, and dryers). Curve 8 peaks around 8 am, while curve 7 approaches its peak around 16 pm. If peak hours begin at 17 pm or 18 pm, these loads can, in many cases, avoid the peak by ending operations at the end of the workday, potentially achieving significant gains.
- Agribusiness with continuous operation/base load (curve 2): fairly flat profile, typical of processes with low operational flexibility (e.g., meat processing plants, large-scale milk cooling, and automated silos). In general, this is a group with less modulation capacity.
- Two-shift cycle (Curve 9): shows increases in the morning and in the afternoon/early evening. It is common in activities such as dairy farming (morning and afternoon milking and cooling). This profile is more sensitive to tariff risk, as the late afternoon operation may coincide with peak hours.
- Marginal capacity costs
The differences in behavior and, consequently, the impact of a White Tariff for subgroups B1 (Residential), B2 (Rural), and B3 (Commercial) demonstrate that the Conventional Tariff includes a broad and barely perceptible cross-subsidy at the same voltage level. When hourly prices that adhere to real marginal costs are applied, the "mask" of the average tariff is removed, making it clearer who is actually burdening the network and who may be bearing costs they did not cause.
By cross-referencing typical usage profiles with distribution network loads, hourly cost curves associated with the provision of TRANSPORT services are obtained — the so-called Marginal Capacity Costs.
In the tariff methodology based on these costs, they are translated into the power component (R$/kW). Essentially, it estimates how much it costs, at the margin, to expand or reinforce the distribution network to meet each 1 kW increase in demand. These marginal costs underpin the value of the Transportation Distribution System Usage Tariff (TUSD Transporte), which more accurately reflects the service costs.
In the real-world example shown in Figure 9, it can be observed that the hourly price ratio between the peak and off-peak stations, under technical signaling, would not be just three times—as in the revenue example in Figure 3—but substantially higher.

Note how the marginal cost of capacity curve, calculated as a function of loads for low-voltage consumer service in the case of Cemig, is almost flat for most of the day and experiences an abrupt rise from 18 PM onwards, remaining quite high until 21 PM.
For the distributor, the electrical grid — wires, transformers, and substations — needs to be sized to support precisely the peak of this "mountain" of demand. In other words, infrastructure investments are made to ensure that the system does not become overloaded precisely during those few critical hours.
During the early morning hours, the grid operates with spare capacity: there is idle capacity in cables and transformers. During these periods, the marginal cost of transporting an additional 1 kW tends to be very low.
The afternoon period (between 14 PM and 17:59 PM) acts as a transition zone or a ramp-up in costs. The electrical grid ceases to be "empty" and begins to become overloaded. This is a yellow alert signal for the consumer.
During the night, the grid approaches its load limit. If demand increases at this time, the marginal cost of meeting this increase may be higher, because it tends to require reinforcements and expansions (a more robust grid, greater transformation capacity and, possibly, new substations) to support the additional load.
The Aneel calculation methodology is capable of indicating hourly capacity cost curves for all voltage levels (A2, A3, A4, and BT) and estimating tariff relationships between any stations that may be defined for these levels. The problem is that there is a regulatory determination in Submodule 7.1 of Proret that restricts the operationalization of the method by stipulating, for the White Tariff, that:
- The fare at the peak station should be equivalent to five times the fare at the off-peak station;
- The fare at the intermediate station must be equivalent to three times the fare at the off-peak station; and
- The tariff at the off-peak station must correspond to the product of the Conventional Monomial TUSD (Transmission System Usage Tariff) by the kz parameter, calculated for each tariff subgroup of the distributor based on typical consumption profiles.
As a result, the hourly signaling of the Transportation Tariff (TUSD Transporte) was weakened: by fixing the relationships between the tariff points and, additionally, introducing the kz parameter — designed to preserve the revenue of the White Tariff subgroups in relation to the Conventional Tariff — the tariff model began to prioritize revenue neutrality at the expense of a more faithful adherence of the Transportation Tariff to the hourly costs of the system. In other words, the aim was essentially to keep the consumer's bill for the Transportation Tariff practically unchanged when migrating from the Conventional Tariff to the White Tariff.
In practice, by applying the kwanza system, the regulator sought to cap the potential savings for the consumer. As a result, the economic signal of the time-of-use tariff was weakened: the expected financial gain was reduced (or disappeared), and without a clear advantage, adoption became less attractive.
With optional time-of-use pricing, the decision to switch to the White tariff tends to depend on whether there is an economic benefit compared to the conventional tariff—that is, a reduction in the bill for the same volume consumed. This saving may or may not require load modulation; however, by seeking to neutralize the difference in billing between the modalities, the regulator eliminated a significant portion of the potential gains and, consequently, reduced the incentive to switch.
- Review of the White Tariff
This weakness in the economic signal, inefficient communication, and the optional (opt-in) nature of the original White Tariff contributed significantly to the low consumer adoption rate. Faced with this failure, Aneel concluded that consumer inertia and lack of awareness hinder tariff modernization in low-voltage systems when it depends exclusively on individual initiative.
In November 2025, the regulator's Superintendencies of Tariff Management and Economic Regulation (STR) and of Regulation of Electricity Transmission and Distribution Services (STD) will be established. Joint Technical Note No. 8/2025 (AIR No. 1/2025, “Modernization of Distribution Tariffs – Cycle 1”), proposed opening a public consultation to discuss price signaling in low voltage, assess the challenges of low adherence to time-of-use tariffs, and indicate regulatory approaches aimed at efficiency in the use of the network, supporting the eventual automatic application of time-of-use pricing to large consumers in this segment.
In this context, Aneel established the Aneel Public Consultation No. 046/2025 (CP 46) to obtain subsidies from society regarding the automatic application of the Time-of-Use Tariff (White Tariff) for low-voltage consumers in subgroups B1 (residential), B2 (rural) and B3 (commercial, industrial and others) with monthly consumption equal to or greater than 1 MWh.
In the process, the regulator adopted a more assertive stance, drawing inspiration from the model already established among Group A consumers (medium and high voltage). Since 1985, these consumers have been subject, on a mandatory basis, to time-of-use tariffs (such as the Blue or Green tariffs).
In the first stage, as indicated in page 29, item 144, of the rapporteur's voteThe Agency foresees the automatic and mandatory transition to the hourly tariff for the largest consumers in subgroups B1 (residential), B2 (rural) and B3 (commercial, industrial and others) — those with consumption exceeding 1.000 kWh/month — by the end of 2026.
Although these consumers represent only 2,5% of low-voltage consumer units, they account for approximately 25% of the total consumption in this segment. Before the effective change in billing, there will be a three-month trial period: consumers will continue to pay the conventional rate, but will receive a simulation on their bill of what they would have paid under the time-of-use tariff, along with guidance on how to reduce the amount to be paid.
In the previous model, it is worth highlighting that Aneel's decision to maintain the White Tariff as optional (opt-in) was, at the time, a pragmatic regulatory strategy to enable its approval in the face of legitimate concerns from consumer protection agencies. Now, the regulator demonstrates regulatory maturity by initiating the mandatory transition for the largest consumers. This approach protects smaller customers and the most vulnerable families, whose peak demand coincides with unavoidable basic needs, such as a hot shower after a day's work, and who lack the flexibility to modulate their usage. This ensures that the modernization of the electricity sector respects the country's severe social limitations.
The target for 2027, as indicated in page 12, item 62, of the rapporteur's voteThe goal is to expand automatic metering to consumers with consumption exceeding 600 kWh/month, while maintaining an installation rate of 2,5 million smart meters per year to facilitate the transitions. With this expansion, the time-of-use tariff would reach 5% of consumer units and approximately 30% of the low-voltage market.
The plan is not simply to apply the current "White Tariff" as it is today, but to reformulate it, as pointed out by the reporting director of Aneel in his vote. Since the current problem in the electrical system is the "Duck Curve"—a phenomenon caused by the excessive injection of solar energy into the grid in the middle of the day, followed by an abrupt need for thermal generation at nightfall—Aneel intends to create a price signal that will lower costs and encourage consumption specifically during periods of solar oversupply.
- Reformulated White Tariff and its effects
In this third part of the article, an "interpretation" of the objectives outlined by the regulator for a possible new White Tariff is presented, and, additionally, simulations of the impacts that this "reformulated" White Tariff could produce are carried out. For this, the current methodology of Proret (Submodules 7.1 and 7.2) was used, making only parameters of the tariff structure more flexible — especially the duration and number of tariff periods, the intensity of hourly signaling, and the kz parameter — in order to incorporate the technical indications quantified by the methodology itself. The regulatory limitations currently imposed on the hourly signaling of the Transport TUSD were not considered.
- kz parameter
A Technical Note ANEEL # 94 / 2012 At the time, it represented progress by requiring that the kz factor of tariffs be calculated by distributor and by subgroup, instead of using national averages. Years later, with the White Tariff, the logic of the parameter remained essentially the same: to contain the economic advantage potentially captured by the White Tariff in the name of revenue neutrality for distributors.
To obtain the reference rates associated with the "reformulated" White Tariff, in this study the kz calculation mechanism was replaced by the traditional revenue reconciliation method, applied by distributor and by voltage level.
When revenue reconciliation is done at the voltage level—that is, treating Low Voltage as a single aggregate—all consumers share the same revenue constraint, but the effective allocation of costs occurs according to the hourly usage profile of the network. Thus, those who put the most pressure on the infrastructure during peak hours (mostly residential B1) tend to absorb a larger share of the costs, while profiles with flatter and predominantly daytime consumption (such as rural B2 and commercial B3) receive a smaller share.
The result is a signaling system that more closely aligns with the marginal costs of capacity and, therefore, a fairer allocation: low-voltage commerce and industry no longer finance, via average tariffs, the expansion and reinforcement of the network demanded mainly by the nighttime peak associated with residential use—especially electric showers.
- Simulations of the potential effects of the new tariff.
The simulations were performed using the same database used in the calculation of the tariff structure currently in effect at Cemig, and considering the application of the new tariff for low-voltage consumers in the eligible subgroups. As a result, the tariff impacts that a "reformulated" White Tariff could produce on the set of consumers in subgroups B1 (residential), B2 (rural), B3 (commercial, industrial and other classes) are presented.
In the hypothetical design of this recalibrated tariff to more accurately reflect the hourly marginal cost curve, TR Soluções envisioned a scenario with four tariff periods:
- Post 1: early morning (between 23 PM and 7:59 AM);
- Station 2: morning (between 8am and 13:59pm);
- Post 3: afternoon (between 14 pm and 17:59 pm);
- Post 4: night shift (between 18 PM and 22:59 PM).
In terms of technical signaling of hourly prices associated with the use of the networks (TUSD Transport), these tariff points would present the following variations in relation to the Conventional Tariff TUSD Transport:
- Post 1: 90% reduction;
- Post 2: 74% reduction;
- Post 3: 3% reduction;
- Post 4: 240% increase.
Therefore, the costs considered were as follows:
- Station 1: R$8,90/kW;
- Station 2: R$23,73/kW;
- Station 3: R$88,64/kW;
- Station 4: R$311,60/kW.

By quantifying an average capacity cost of R$311,60/kW at the Night Shift, this tariff design would be sending a very clear economic signal to consumers in subgroups B1, B2, and B3: "if you use the network during this critical period, you will have to pay the real cost of the infrastructure necessary for it."
For comparison, in the traditional model — the conventional method, with a uniform price throughout the day — the same methodology results in a tariff based on a single average capacity cost of R$91,66/kW, as shown in the following graph.

- Tariff impacts
The low-voltage consumer database used to calculate Cemig's current tariff structure includes the following number of typical usage curves:
- 15 representative curves of subgroup B1 (residential);
- 11 from subgroup B2 (rural);
- 11 of subgroup B3 (industrial);
- 12 of subgroup B3 (commercial); and
- 11 of subgroup B3 (public service).
For tariff impact simulation purposes, the value that the markets represented by their respective typical usage curves would pay for TUSD Transportation was quantified in two scenarios: (i) application of the Conventional Tariff and (ii) application of the "reformulated" White Tariff devised by TR Soluções. The analysis assumes that there would be no changes in usage habits, i.e., it considers that the typical usage curves would remain unchanged.

Main results:
- Subgroup B1 (residential), corresponding to 65,4% of the analyzed market: the TUSD Transportation charge for this group would have an average increase of 8,0%, with 53,5% of consumers observing a 22,2% increase in their TUSD bill, while the remaining 46,5% would have an average reduction of 8,3%.
- Subgroup B3 (commercial, industrial and services), corresponding to 24,7% of the total universe analyzed: 85,1% of consumers would benefit from an average reduction of 23,1% in their Transportation TUSD bill, while 17,9% would see an average increase of 12%.
- Subgroup B2 (rural), corresponding to 9,8% of the analyzed market: 73,9% of them would have an average reduction of 22,0% in their bill, while the remaining 26,1% would show an average increase of 19,7%. Due to a consumption profile more concentrated in the morning and early afternoon (outside of peak hours), this class tends to be, in general, the most benefited by the White Tariff.
It is crucial to emphasize that the calculations refer to a scenario of total inertia, with the maintenance of current habits. The premise of the new white tariff is precisely to force the shift of this consumption to times when the network is idle, which would transform this potential increase into savings.
In summary, the adoption of the White Tariff tends to mitigate the cross-subsidy inherent in the Conventional modality. The model indicates that subgroups B2 (Rural) and B3 (Commercial) — whose load profiles, for the most part, do not coincide with the peak load of the system — end up bearing disproportionate costs under a uniform price structure. By migrating to a time-of-use signaling system more aligned with costs, these classes capture significant tariff reductions, on the order of 20% to 23%.
Conversely, the scenario highlights the allocative inefficiency of subgroup B1 (Residential): by concentrating a significant portion of consumption during periods of greatest stress on the distribution infrastructure, this segment, under the premise of behavioral inertia, shows an average increase of 22% in transportation costs. This dynamic reinforces that hourly pricing tends to allocate marginal capacity costs to the profiles that effectively determine the sizing and expansion of the network, while simultaneously relieving those that contribute to the better utilization of assets during periods of greater idleness.
- The technological factor and breaking behavioral inertia.
The main premise adopted in the simulations of this study was that of behavioral inertia, that is, it was assumed that there would be no changes in usage habits and that typical consumption curves would remain unchanged. This hypothesis, however, tends to diverge from the real behavior expected for the coming years, driven by the advancement of new technologies and active forms of consumption management, such as the introduction of plug-in electric vehicles, hybrid inverters, and battery-based energy storage systems (BESS).
The daily energy consumption for recharging a plug-in electric vehicle, for example, can be comparable to that of an entire middle-class household. In this context, a time-of-use pricing system—with lower prices during the early morning hours—can substantially reduce the cost of recharging while, considering the projected growth of the market for these vehicles, relieving the strain on the grid and limiting the need for investments in reinforcements. Compared to the Conventional Tariff, shifting this charging to "Station 1" (early morning) can result in savings of up to 90% in expenses associated with the TUSD Transportation component of the tariff.
The integration of hybrid inverters coupled with batteries also opens up a new horizon. This arrangement allows the prosumer (producer and consumer) to manage electricity compensation and shape the load profile seen by the distributor, injecting or consuming energy strategically to circumvent the most critical and expensive periods of grid load.
For low-voltage consumers, batteries can play a role analogous to that of traditional diesel generators used by medium-voltage customers (covered by the Green Tariff): they allow consumers to partially or fully modulate their demand during the night, reducing exposure to peak hours without sacrificing comfort or operational efficiency.
Finally, it is worth reflecting on market dynamics. Many consumers have migrated to the Free Contracting Environment (ACL) motivated by the discounts on transportation costs obtained when contracting energy from incentivized sources. However, a time-of-use pricing system with well-defined periods and signaling that adheres to the marginal costs of capacity can provide, at specific times, reductions of up to 90% in transportation costs — as demonstrated in this study.
These are just some of the possibilities and strategies that, aligned with tariff modernization, can transform an initial expectation of higher bills into a significant structural reduction in electricity costs.
- final comments
Although analysis by TR Soluções indicates that a significant portion of the market—especially families in subgroup B1—would see an increase in their energy bill by switching to the White Tariff without changing their consumption habits, the adoption of time-of-use tariffs is widely advocated by experts in the electricity sector due to the systemic benefits it can provide.
The electrical system is designed to meet the highest consumption of the day (the "peak of the mountain," starting at 18 PM, as shown in the marginal cost figure). By signaling a cost of R$ 311,60/kW during this period, the tariff induces behavioral changes: consumers postpone flexible uses (such as washing clothes), and companies can modulate processes, reducing demand during peak hours.
This shift in consumption to alternative times flattens the load curve, making the system's operation more linear and predictable throughout the 24 hours and reducing stress on equipment. By containing peak demand growth through time-of-use signaling, the distributor can postpone investments in network reinforcements. As these infrastructure costs end up being passed on to tariffs, less need for expansion tends to translate into less tariff pressure in the medium and long term.
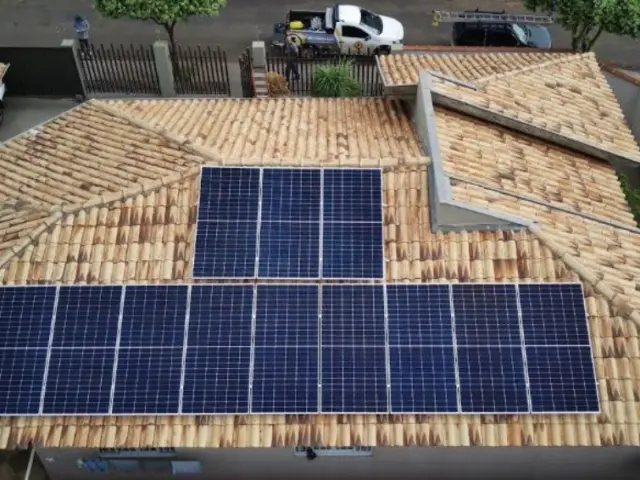
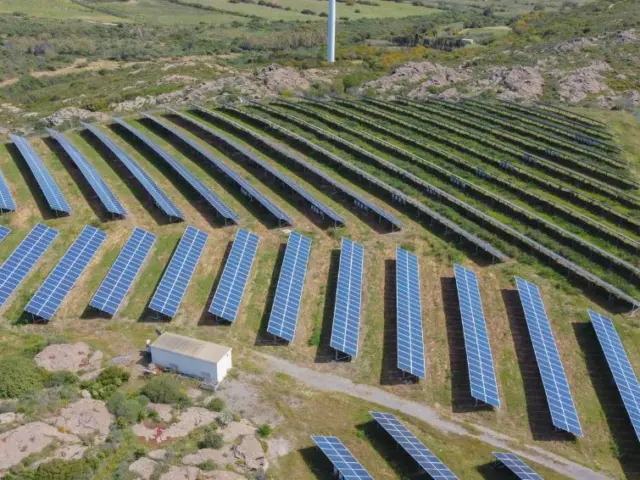
Furthermore, the time-of-use pricing aligns particularly favorably with solar generation: the cheapest charging points (morning and afternoon) coincide with the period of highest photovoltaic production. Encouraging consumption during the day helps to absorb available solar energy, reducing waste and improving the use of a clean and marginally low-cost source.
In a conventional tariff system—with a uniform price throughout the day—the high cost of meeting consumption during peak hours is diluted in the average tariff, which can lead to distortions. A consumer who uses the network little during peak hours (for example, an establishment that closes before the start of the most expensive time) ends up contributing, via the average tariff, to cover the infrastructure costs required by those who concentrate their consumption in the early evening.
Time-of-use pricing reduces this type of cross-subsidy by bringing prices closer to the effective costs of the system, promoting economic efficiency through more appropriate allocation: those who demand the network most during critical times bear a larger share of the cost associated with expansion. Conversely, consumption during off-peak hours (early morning and part of the morning) tends to be cheaper because, during these periods, the marginal cost of service is, in fact, lower.
It is crucial to emphasize that, although the simulations in this study are based on Cemig's data and technical assumptions established by TR Soluções, the impacts tend to vary according to the specific characteristics of each concession. The methodology applied here allows for the projection of customized scenarios for any distributor in the country, enabling a precise technical analysis that adheres to the specific needs of each agent in the sector.
Finally, it is important to highlight that the "reformulated White Tariff" outlined here strictly reflects an analytical exercise by TR Soluções on a "possible" evolution of the model. The effective methodological definition and the final rules for how this tariff reformulation will take place are the exclusive prerogative of Aneel.
The opinions and information expressed are the sole responsibility of the author and do not necessarily represent the official position of the author. Canal Solar.


Comments (1)
Comments are moderated before publication.Comments should be respectful and contribute to a healthy debate. Offensive comments may be removed. The opinions expressed here are those of the authors and do not necessarily reflect the views of the author. Canal Solar.
Excellent article!