
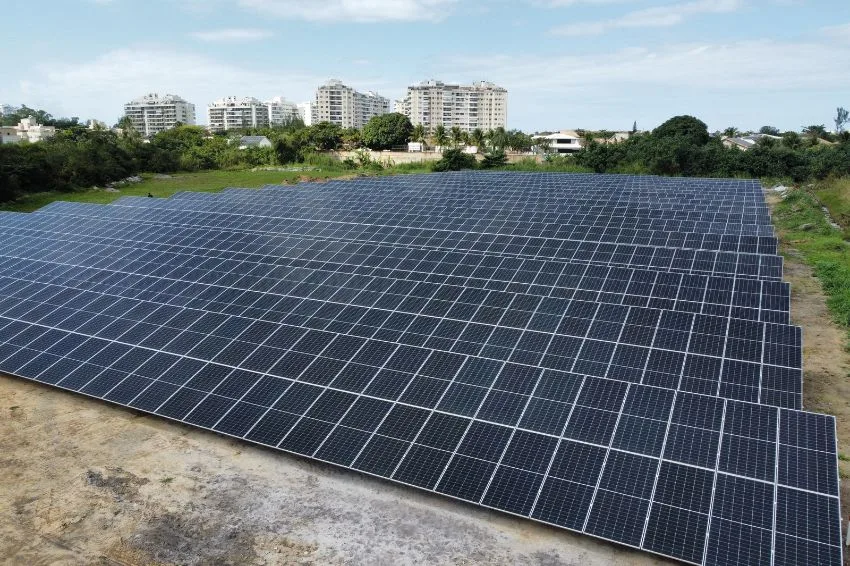
The centralized generation project market is highly competitive. On the supply side, the development of new photovoltaic (PV) and wind power (WEP) projects continues to grow.
There are already more than 330 GWac in projects with a Grant Application Registration Order (DRO) issued from both sources, of which 242,8 GWac are from UFVs (ANEEL, 2022a).
On the other hand, in the Regulated Contracting Environment (ACR), many distributors remain subcontracted.
Consequently, the viability of new projects, “for some years now”, has depended mainly on the Free Contracting Environment (ACL), in which there is direct competition between all sources.
In an environment of high competition and free competition between sources, the projects that have the greatest chance of being implemented are those capable of producing electricity at a lower cost.
In this context, the loss of competitiveness of the photovoltaic source in Brazil since 2020 has been a major challenge for the entire sector.
Aiming to assist project developers and investors interested in the source, this article aims to map and understand the main factors that determine the competitiveness of a UFV project in Brazil.
Main competitiveness factors
Figure 1 consolidates a list of these key factors. They are classified into three categories:
- Endogenous: those intrinsic and particular to each project;
- Exogenous: applicable to all photovoltaic projects regardless of their particularities – however, not necessarily beyond the entrepreneur’s control;
- Cross-cutting: they depend on other factors – partly endogenous and partly exogenous.
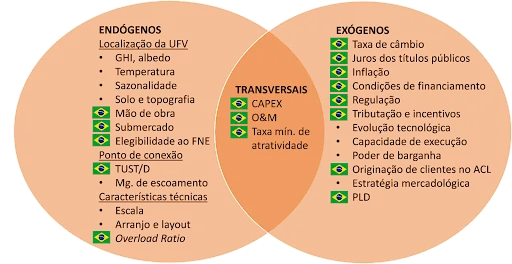
The Brazilian flags shown in Figure 1 aim to highlight the competitiveness factors that differentiate a Brazilian photovoltaic project from those developed in other countries.
Factors endogenous to the project
The endogenous factors listed are consequences of the choices made by the company developing the project. The main ones are the location of the UFV, the connection point, and its technical characteristics.
The choice of location has a significant impact on the performance of a future UFV. It influences, for example, the level of global horizontal irradiance (GHI), albedo, and ambient temperature. The higher the GHI and albedo, and the lower the temperature, the higher the UFV's capacity factor.
Location also has indirect impacts on the CAPEX budget. Hypothetically, if the topography and soil conditions for piling the Trackers of the chosen location are not favorable, the project will require greater investments.
If there are limitations in the availability and qualification of labor in the surrounding area, or even unfavorable logistical infrastructure, there will be an impact on costs and the implementation timeframe of the UFV.
The choice of connection point, in turn, impacts the project's competitiveness in several ways. The further the project is from the connection point, the greater the investment and maintenance cost of the connection infrastructure, and the greater the losses.
If the project requires a line sectioning, the investment will be greater and the implementation deadline will be more uncertain.
The connection voltage, the scope of any necessary network reinforcements and the risk of unavailability of the UFV's electricity flow margin are also consequences of this choice.
The location of the UFV and the connection point also generates relevant costs and expenses; for example, payment for the use of the properties and, mainly, the Transmission/Distribution System Use Charge (EUST/D).
This is a function of the Transmission/Distribution System Usage Tariff (TUST/D), which is different for each connection point.
For reference, the impact on the cost of producing electricity from a UFV for each increase of R$1,00/kW/month of TUST/D is greater than R$2,00/MWh, considering the 50% discount (RUIZ, 2021a)[i].
The location of UFV also determines its submarket for the purpose of selling electricity.
Currently, electricity produced in the Southeast/Central-West submarket is sold at higher prices than that produced in the Northeast. Furthermore, wind power is less competitive in the Southeast/Central-West region.
On the other hand, projects located outside the company's area of operation Northeast Development Superintendence (SUDENE), are not eligible for financing with resources from the Constitutional Fund for Financing the Northeast (FNE) and the Northeast Development Fund (FDNE).
These sources are considerably more competitive than BNDES and the capital markets. The definition of the technical characteristics of the UFV has a great impact on the cost of producing electrical energy. It directly affects UFV's performance, CAPEX, operating costs and expenses, among others.
This work involves, in summary, the definition of the UFV power, both in direct current (DC) and alternating current (AC), of the photovoltaic array (array) and the plant layout. The ratio of DC power to AC power is called Overload Ratio.
It is up to the project developer to find the configuration that will enable the production of electrical energy at the lowest cost, that is, the one that maximizes the creation of value for the investor. However, it should be noted that the optimal configuration is not necessarily the best one. performance ratio.
Optimizing a project's technical characteristics depends on multiple endogenous factors, as well as some exogenous and cross-cutting ones. Therefore, each project is unique.
Exogenous and transversal factors
The loss of competitiveness of photovoltaic energy from 2020 onwards is due to factors that affect all projects in Brazil and are beyond the control of developers.
These are: the major devaluation of the real (exchange rate); the increased cost, in foreign currency, of imported equipment and components and international sea freight (CAPEX factor); and the rise in interest rates on government bonds and inflation.
More than 50% of a UFV's CAPEX is priced in foreign currency, which also affects the UFV's operation and maintenance (O&M) cost.
Therefore, for projects with revenue in reais, the lower the exposure of CAPEX and O&M costs to foreign currencies, the better.
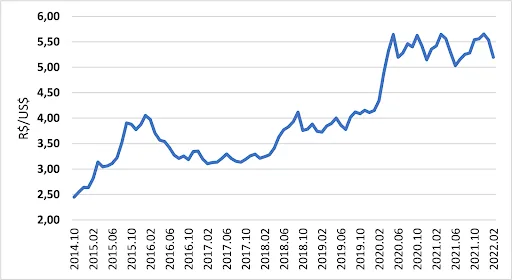
Figure 2 illustrates the history of the average monthly dollar exchange rate – and its volatility – starting in October 2014, when the first Regulated Contracting Environment (ACR) auction took place with winning photovoltaic projects.
The recent rise in the futures interest rate curve and inflation indirectly impact the cost of producing electricity from new projects.
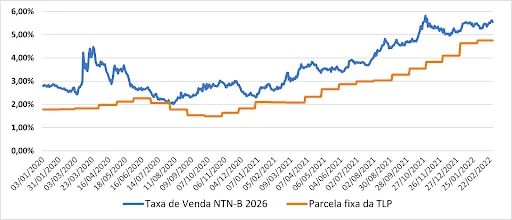
Figure 3 illustrates the increase of around 300 basis points (3% per year) in the National Treasury Note (NTN-B) rate over the last 12 months, and of 266 basis points (2,66% per year) in the fixed portion of the Long Term Rate (TLP), which makes up the financing cost of the BNDES, FNE and FDNE.
The higher the interest rates on government bonds and inflation, the higher the Minimum Attractiveness Rate (MAR) of equity capital required by investors.
These factors, however, affect projects from all sources.
The increase in interest rates, however, was not the only unfavorable change in project financing conditions.
In the case of the FNE, the availability of resources for renewables fell considerably from 2020 onwards, and the financial leverage limit was reduced by 50% of the project budget.
For 2022, there is an additional restriction that new hires are limited to R$300 million per economic group, which favors the competitiveness of medium-sized UFVs.
On the other hand, since August 2020, BNDES has implemented a new, more flexible methodology for accrediting photovoltaic systems. The new rule has contributed to the viability of numerous UFV projects that, for different reasons, were unable to access resources from the FNE or FNDE.
Two other exogenous factors specific to Brazil are the regulation of the electricity sector and taxation. In these topics, any rule change can impact the relative competitiveness of the source, whether for better or worse. Therefore, it requires ongoing monitoring and attention from stakeholders.
The main example of an unfavorable regulatory change for the source is the forecast of the end of the discount on TUST/D, established by Law No. 14.120/21[i]. As it is a tariff on power, the impact will be much more severe on the photovoltaic source than on other renewable sources (RUIZ, 2021a).
Furthermore, the end of the discount will negatively impact the sale price of electricity by UFVs in the free market, given that it also applies to consumers of incentivized energy.
Another relevant regulatory issue, still under discussion, is the change in the TUST calculation methodology to increase the weight of the locational signal.
The potential change tends to increase the TUST of operational plants dedicated exclusively to the ACL and new projects located in the Northeast submarket and, in return, favor those located in the Southeast.
Among the recent regulatory changes favorable to the source, the following stand out: publication by ANEEL of Normative Resolution 954/21[ii], which deals with associated and hybrid projects; and Law No. 14.286/21[iii] which provides greater legal certainty for the execution of electricity sales contracts with payment in foreign currency with free consumers who are exporters. Both are good opportunities to increase the competitiveness of photovoltaic projects.
Regarding tax changes, some of the issues of greatest concern to the sector have been: maintaining the ex-tariff status for imported equipment and components; and the various tax reform proposals under discussion in the Chamber of Deputies and the Senate.
Bills 2.337/21 and 3.887/20, for example, would reduce the competitiveness of the Presumed Profit tax regime, widely adopted by UFVs and UEEs. Consequently, they would favor the relative competitiveness of plants under the Real Profit regime, including fossil-fueled thermoelectric plants and large hydroelectric plants (RUIZ; EDELSTEIN, 2021)[iv].
Technological advancements, in turn, have historically proven to be the main factor in increasing the competitiveness of photovoltaic energy. In this case, this refers to both increased system performance and the, until now, systematic reduction in CAPEX.
The project's investor profile also plays a significant role in UFV's competitiveness. For the same project, an investor requiring a lower equity MARR can offer cheaper electricity.
It's worth noting that the MARR of the equity capital to be applied to the project should also consider the project's risk assessment. For this reason, the MARR was classified as a cross-cutting factor.
Additionally, the investor's profile can contribute positively whenever it results in more favorable financing conditions, such as due to the group's financial health or its capacity and track record of executing similar projects. Finally, the greater the investor's bargaining power with suppliers, the more competitive the project's CAPEX and O&M will be.
With ACL's increased prominence in enabling new projects, its customer acquisition capabilities and marketing strategy have become important competitive differentiators. When it comes to the ability to attract clients, again, the investor's profile can make a difference. For example, in the case of large companies in the electricity sector that have marketing companies within the same economic group.
On the topic of strategy, to cite one example, the Energy Self-Production (APE) regime allows for numerous contractual arrangements, which opens up space for greater gains for the project and the electricity consumer.
Also, depending on the marketing strategy, a project will be more or less exposed to the PLD value, which is completely beyond the investor's control.
Relative competitiveness
The conclusion regarding the level of competitiveness of a UFV project requires comparison with other photovoltaic projects, as well as with competing projects and operational plants from other sources.
This comparison is fundamental in a context of oversupply of renewable energy projects and the strong pace of expansion of wind power.
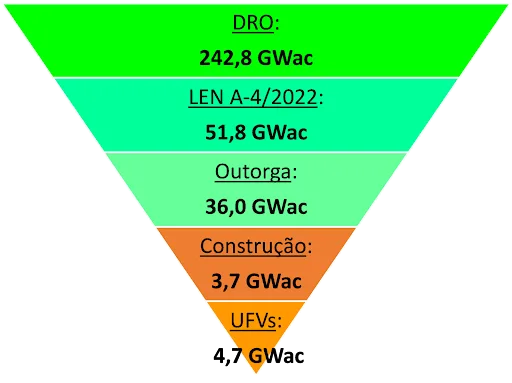
In March 2022, according to the ANEEL (2022), there were 5.630 UFV projects with DRO, totaling 242,8 GWac. For reference, the Brazilian electricity matrix has an operational power of 182,4 GWac, adding up all sources.
Of the UFV projects with DRO, only 893 (36 GWac) had their authorization granted published. Of these, just over 10% (96 projects – 3,7 GWac) were under construction on this date.
Another indication of the oversupply of projects is the data on projects registered for the 4 New Energy Auction (LEN) A-2022. 1.894 projects totaling 75,25 GWac were registered, of which 1.263 projects (51,8 GWac) were from UFV and 542 (21,4 GWac) were from wind power (EPE, 2022)[i].
It should also be considered that, of the 242,8 GWac contingent, there are not only projects greenfield under development. There are also expansion projects for operational UFVs and a new, growing generation of photovoltaic projects associated with UEE (Wind Power Plants) operational.
Both are types of projects with lower implementation risk and are potentially more competitive than the average project. greenfield independent (RUIZ; SCARAMUCCI, 2022)[ii].
In 2021, both photovoltaic and wind power sources broke records in installed power volume. According to ANEEL (2022), 1.539 MWac of UFVs came into operation in 2021, double the average for the period between 2017 and 2020. However, wind power had a 140% higher addition, of 3.694 MWac.
If the sources are compared in terms of electricity supply, in average MW, wind power surpassed photovoltaic power by more than four times. It is important to mention that, starting with LEN A-4 of 4, wind and photovoltaic projects will also begin to compete directly in the regulated environment (MME, 2022)[iii].
Conclusions
In this challenging situation of oversupply of projects, free competition between sources and the recent loss of competitiveness of the photovoltaic source, it is essential to concentrate efforts on projects capable of producing electricity at a lower cost.
Hence the importance of mapping and understanding the main factors that determine the competitiveness of a UFV project in Brazil.
As each project has its own particularities, investment analysis requires customization, depth, technical rigor and impartiality.
It must include a robust technical and economic feasibility study, including independent verification of assumptions to ensure they are up to date and free from errors, omissions, and bias.
A detailed prior risk analysis should also be considered, with the development of a risk management plan tailored to the project. Furthermore, the conclusion regarding the competitiveness of a UFV project still depends on comparison with operational plants and projects from other sources, especially wind power.
References
ANEEL. SIGA – Generation Information System ANEEL. 2022. Available at: https://app.powerbi.com/view?r=eyJrIjoiNjc4OGYyYjQtYWM2ZC00%20YjllLWJlYmEtYzdkNTQ1MTc1NjM2IiwidCI6IjQwZDZmOWI4LWVjYTctNDZh%20Mi05MmQ0LWVhNGU5YzAxNzBlMSIsImMiOjR9. Accessed on: 03 mar. 2022.
CAPEX – Capital Expenditures (capital investments).
RUIZ, ETNF Impact of the end of the TUST/D discount on the competitiveness of photovoltaic projects. Fotovolt Magazine, São Paulo, v. 7, n. 43, , p. 56-59, Nov./Dec. 2021a.
SUDENE – Superintendence for the Development of the Northeast.
NATIONAL TREASURY. Price and rate history: NTN-B. 2022. Available at: https://www.tesourodireto.com.br/titulos/historico-de-precos-e-taxas.htm. Accessed on: 25 Feb. 2022.
BNDES. History of the fixed portion of the TLP. 2022. Available at: https://www.bndes.gov.br/wps/portal/site/home/financiamento/guia/custos-financeiros/historico-da-parcela-fixa-da-tlp
BRAZIL. Law No. 14.120, of March 1, 2021. Provides for the transitional rule for the end of the TUST discount. Official Gazette of the Union, Brasilia, 2021.
ANEEL. Normative Resolution No. 954, of November 30, 2021. Establishes regulatory treatment for the implementation of UGH and associated generating plants. Official Gazette, 06 Dec. 2021.
BRAZIL. Law No. 14.286, of December 29, 2021. Provides for the Brazilian foreign exchange market, Brazilian capital abroad, foreign capital in the country and the provision of information to the Central Bank of Brazil. Official Gazette of the Union, Brasilia, 2021.
RUIZ, ETN F; EDELSTEIN, A. Impacts of PL 2.337/2021 on the Competitiveness of Wind Projects. Wind Scenarios Portal. Editora Brasil Energia. Published on November 01, 2021. Available at: https://cenarioseolica.editorabrasilenergia.com.br/2021/11/01/impactos-do-pl-2-337-2021-na-competitividade-de-projetos-eolicos/
EPE. Registration Report: 4 New Energy Auction A-2022. 2022. Available at: https://www.epe.gov.br/sites-pt/publicacoes-dados-abertos/publicacoes/PublicacoesArquivos/publicacao-644/Informe%20Cadastramento%20LEN%20A4-2022-Final.pdf
RUIZ, ETN F; SCARAMUCCI, HFA Advantages and challenges of developing photovoltaic projects associated with operating wind farms. Wind Scenarios Portal. Editora Brasil Energia. Published on January 28, 2022. Available at: https://cenarioseolica.editorabrasilenergia.com.br/2022/01/28/vantagens-e-desafios-do-desenvolvimento-de-projetos-fotovoltaicos-associados-a-usinas-eolicas-em-operacao/
MME. Normative Ordinance No. 34, of December 22, 2021. Establishes the guidelines for carrying out LEN A-4/2022. Available at: https://www2.aneel.gov.br/aplicacoes/editais_geracao/documentos/prt2021034mme.pdf.
The opinions and information expressed are the sole responsibility of the author and do not necessarily represent the official position of the author. Canal Solar.


Comments
Comments are moderated before publication.Comments should be respectful and contribute to a healthy debate. Offensive comments may be removed. The opinions expressed here are those of the authors and do not necessarily reflect the views of the author. Canal Solar.