
With collaboration from Geraldo Silveira
In the final weeks of the second half of 2024, there was intense discussion about the return of daylight saving time, which had been abolished since 2019. Among the most debated topics was the potential for savings during peak consumption times.
One of the main arguments for the return of daylight saving time would be the possibility of alleviating power demand on the electrical system during peak periods, generally concentrated between 18 pm and 21 pm.
With daylight saving time, this window of greatest consumption would coincide with a time of day when there is still sunlight, which could reduce the need to activate generators that have fossil fuels as their primary source, such as thermoelectric plants.
These sources are not only more expensive, they also have a greater environmental impact, but they are often necessary to meet these peaks in demand. Furthermore, there is a discussion that the return of daylight saving time could benefit the electricity sector in terms of system security and stability.
With a decrease in peak demand, transmission and distribution networks would face less overload, reducing the risk of blackouts and other technical problems. In addition to this, the discussion also arose regarding how much daylight saving time could impact the economic return for those who own photovoltaic solar generation systems, mainly due to a possible impact on simultaneity.
Taking advantage of this theme, this article aims to present a study of the influence of daylight saving time on self-consumption of energy from solar energy sources. The objective is to show whether there is a significant increase in the simultaneity between photovoltaic generation and customer consumption.
This increase in simultaneity would help improve the economic return of the photovoltaic system, in addition to demanding less energy from the National Interconnected System and, consequently, reducing demand at critical times.
According to NT-ONS DPL 0093/2024, the ONS (National Electric System Operator) highlighted some benefits for the reintroduction of daylight saving time in the South, Southeast and Central-West subsystems, especially with regard to the reduction of peak demand at night.
Figure 1 illustrates an example of the typical load curve for the Southeast/Central-West subsystem, comparing scenarios with and without the adoption of daylight saving time.
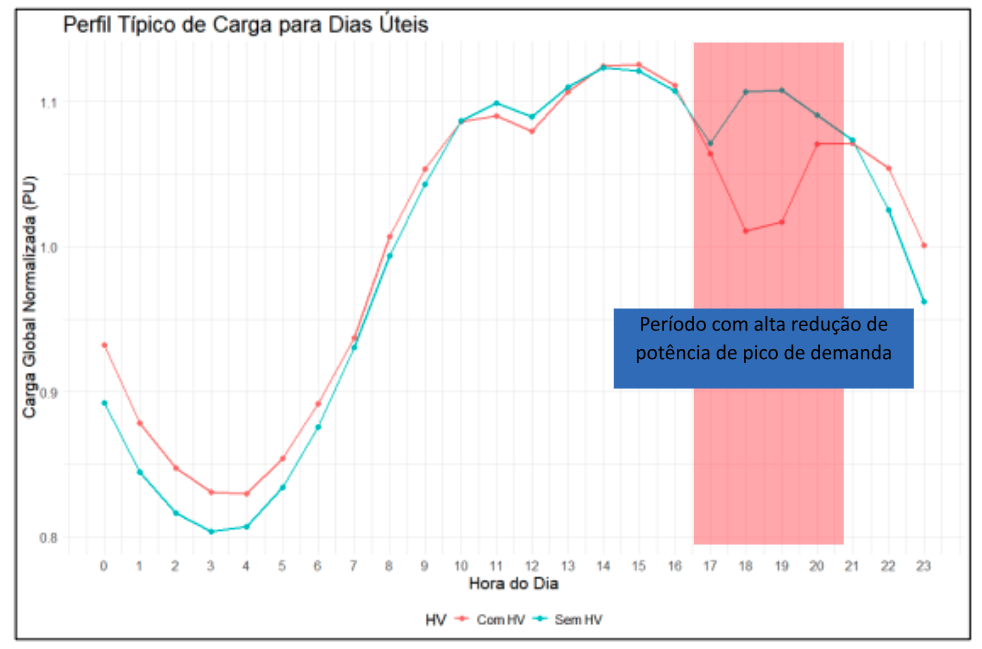
Although the ONS Technical Note demonstrated that there was no significant reduction in the total energy consumption of the subsystems analyzed, a decrease in peak power was observed at night. This reduction has two financial impacts, one short-term and one long-term, respectively:
- Reduction in fuel costs: savings of up to R$356 million in the use of fuel for thermoelectric plants;
- Reduction in the cost of hiring capacity reserve: the drop in peak demand could generate annual savings of around R$1,8 billion, according to the ONS.
The study conducted by ONS is systemic, encompassing different forms of generation and energy consumption profiles. However, the following questions arise: what is the impact of DST For low-voltage residential consumers with photovoltaic systems? Is this impact significant? This article aims to answer these questions.
Daylight saving time for residential consumers
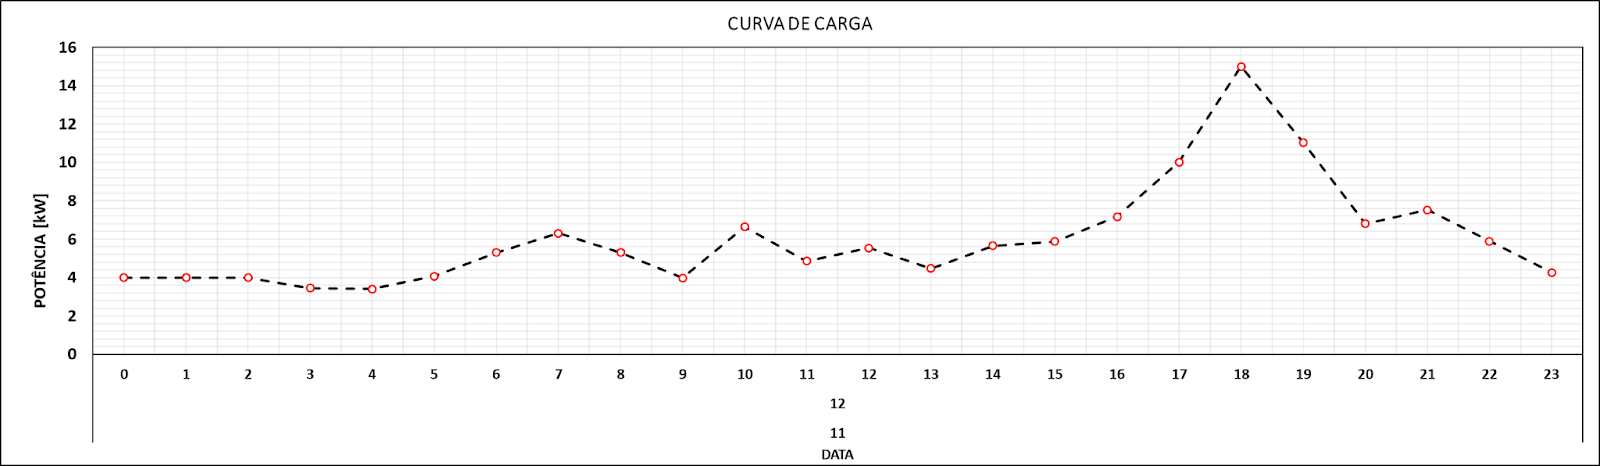
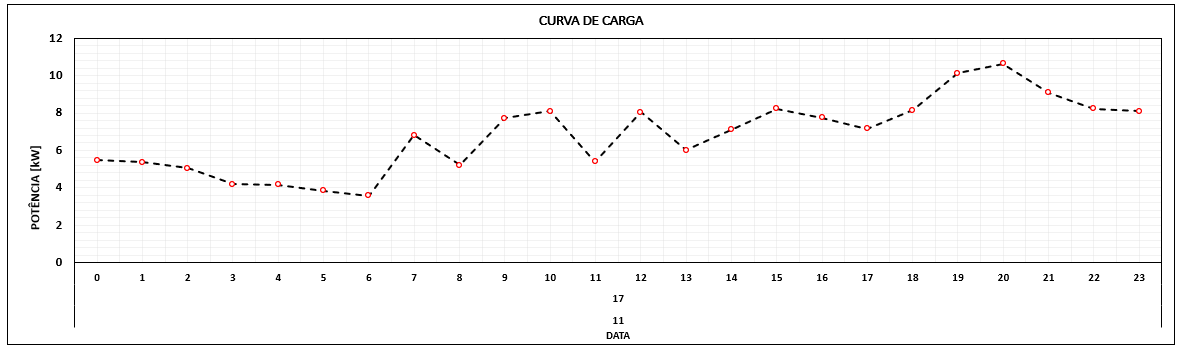
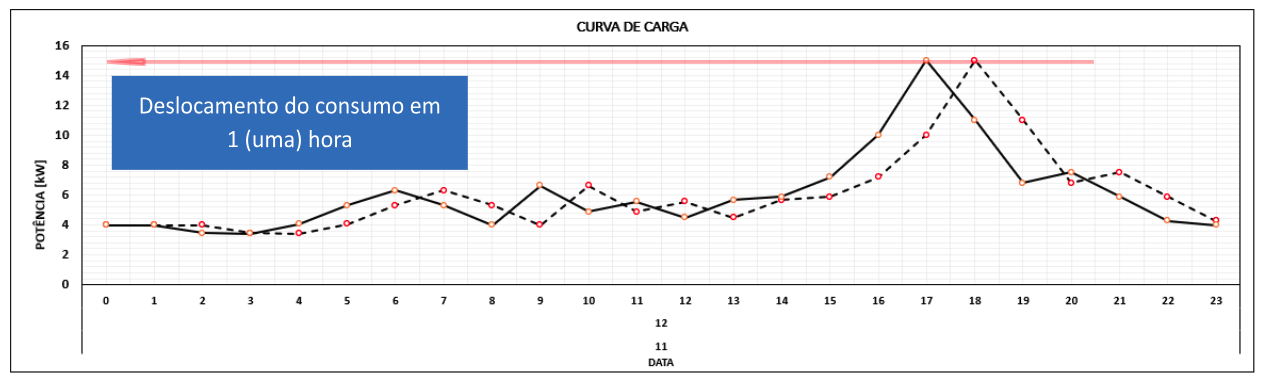
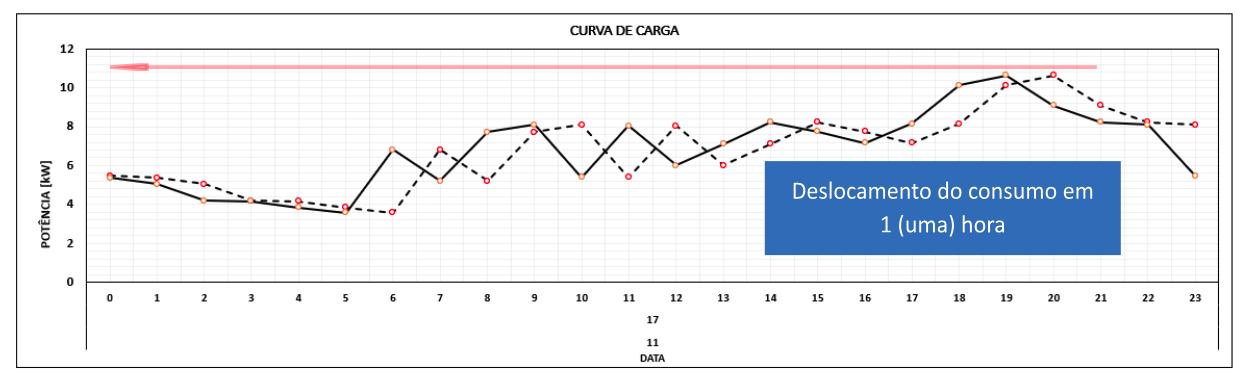
To assess the impact of daylight saving time on residential consumers, the consumption profile of a transformer in the medium/low voltage network of the CPFL Paulista utility company, which supplies mainly residential customers, was analyzed. Figures 2 and 3 show the load curves for weekdays and weekends, respectively.
The modeling of this study assumes that the consumption habits of residential customers do not undergo significant changes with the change in daylight saving time, that is, the comparison of whether or not daylight saving time is introduced will be carried out considering that the customer maintains the same energy consumption habits.
Thus, the main consequence is a shift in the load curve forward by one hour. Figures 4 and 5 show this shift for weekdays and weekends. Note that, since the clock is advanced by one hour during daylight saving time, for comparison with the solar generation system, it is as if the load curve shifts one hour to the left, as shown in Figure 4.
The peak consumption that previously occurred around 18 PM now occurs at 17 PM, if we take the projection of sunlight on Earth as a reference. This becomes easier to see if we consider that if we finish work at 18 PM every day and night is approaching, during daylight saving time the end time remains 18 PM, but night will take longer to arrive, since the clock has been moved forward one hour.
Of course, there is the summer solstice effect here, in which the days are longer than the nights, but this situation does not change with the adoption or not of daylight saving time.
Variation of simultaneity of photovoltaic generation with daylight saving time
A 30 kW (CA)/37,4 kWp photovoltaic system was considered adequate to meet the average demand of the analyzed branch, according to the data extracted from the load curves presented in Figures 2 and 3.
Figure 6 shows the table with the total monthly consumption and generation, in addition to the annual average of each of these variables (consumption and generation). The generation under analysis was obtained from the PVsyst simulation of the photovoltaic system proposed in this topic (37,4 kWp) that aims to meet the consumption demand.
The simulated system considered was for the city of Campinas (SP), to meet the load curve presented, in the CPFL Paulista concession area.
| Month | Consumption | Solar energy |
|---|---|---|
| 1 | 4633,44 kWh | 4653,44 kWh |
| 2 | 4199,76 kWh | 4015,03 kWh |
| 3 | 4652,45 kWh | 4888,89 kWh |
| 4 | 4507,89 kWh | 4968,80 kWh |
| 5 | 4633,44 kWh | 4779,27 kWh |
| 6 | 4507,89 kWh | 4339,65 kWh |
| 7 | 4652,45 kWh | 4920,93 kWh |
| 8 | 4633,44 kWh | 5027,00 kWh |
| 9 | 4526,90 kWh | 4788,22 kWh |
| 10 | 4633,44 kWh | 4926,02 kWh |
| 11 | 4488,88 kWh | 4542,05 kWh |
| 12 | 4671,46 kWh | 4651,11 kWh |
| Media | 4561,79 kWh | 4708,37 kWh |
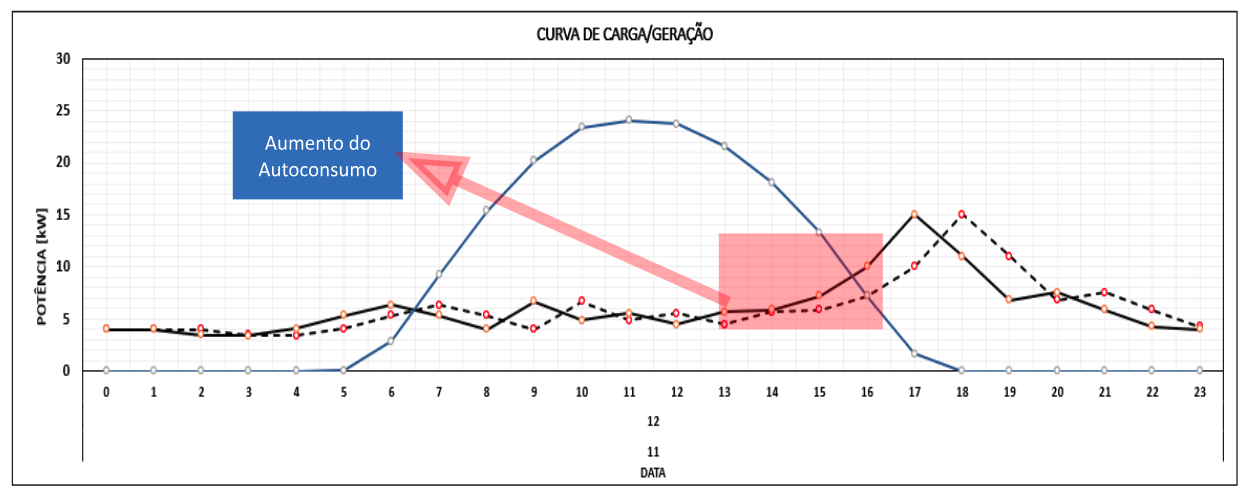
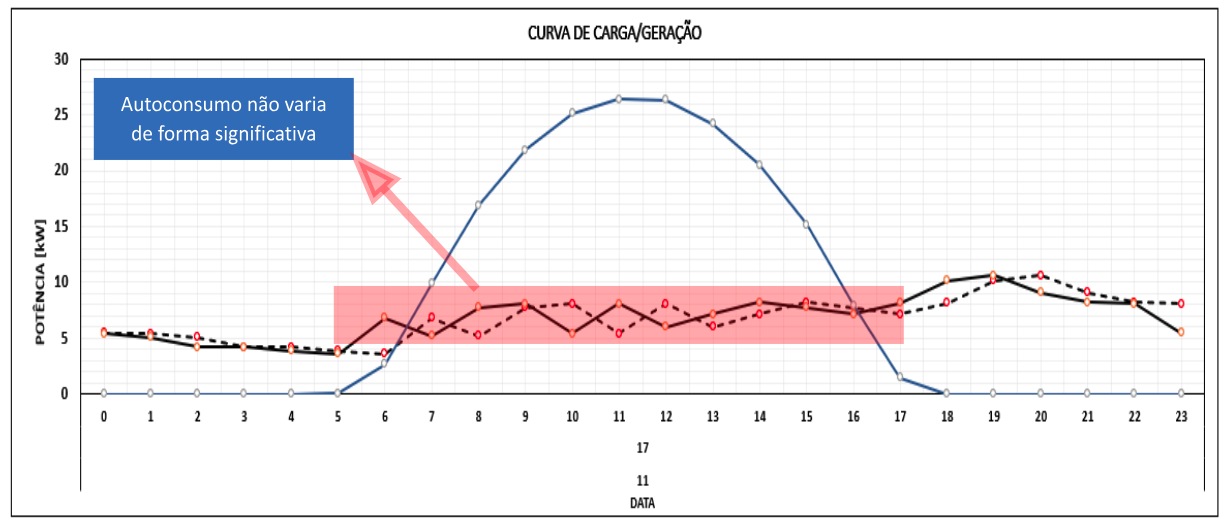
To assess the impact of daylight saving time on self-consumption, it is necessary to simultaneously analyze the load and generation curves with and without daylight saving time. Figures 7 and 8 show these curves.
It is observed that, on weekdays, self-consumption in the late afternoon increases due to the shift of the load curve to the left, approaching the generation curve, as already explained in the previous topic.
However, on weekends, no significant changes were observed, as the consumption profile was quite linear.
Based on the generation and consumption curves, the percentage of self-consumption with and without the application of daylight saving time was tabulated. Since daylight saving time covers the months of November to February, the table in Figure 9 reflects this variation only for these months, so that an analysis of the result of the impact of daylight saving time on the variation in simultaneity can be made.
| Month | Consumption (kWh) | Solar energy (kWh) | % normal concurrency | % simultainity summer time | Simultaneity change | DST |
|---|---|---|---|---|---|---|
| 1 | 4633,44 | 4653,44 | 39,57 % | 40,87 % | 1,30 % | YES |
| 2 | 4199,76 | 4015,03 | 41,76 % | 43,19 % | 1,43 % | YES |
| 3 | 4652,45 | 4888,89 | 38,51 % | 38,51 % | 0,00 % | NO |
| 4 | 4507,89 | 4968,80 | 35,08 % | 35,08 % | 0,00 % | NO |
| 5 | 4633,44 | 4779,27 | 36,65 % | 36,65 % | 0,00 % | NO |
| 6 | 4507,89 | 4339,65 | 36,69 % | 36,69 % | 0,00 % | NO |
| 7 | 4652,45 | 4920,93 | 35,37 % | 35,37 % | 0,00 % | NO |
| 8 | 4633,44 | 5027,00 | 34,76 % | 34,76 % | 0,00 % | NO |
| 9 | 4526,90 | 4788,22 | 37,06 % | 37,06 % | 0,00 % | NO |
| 10 | 4633,44 | 4926,02 | 38,09 % | 38,09 % | 0,00 % | NO |
| 11 | 4488,88 | 4542,05 | 39,05 % | 39,73 % | 0,68 % | YES |
| 12 | 4671,46 | 4651,11 | 41,05 % | 42,14 % | 1,09 % | YES |
The analysis indicates that, for this case study, the average increase in self-consumption during DST is approximately 1,125%. This means that DST would increase on average the simultaneity of this consumption profile by only 1,125%, a rather irrelevant value.
The month in which the difference would be greatest, February, this increase would be 1,43%, demonstrating that daylight saving time would have little impact on the consumption/photovoltaic generation ratio of a low-voltage residential customer.
Conclusion
Based on the premises of this study, it was found that daylight saving time promotes an average increase of 1,125% in the self-consumption of residential customers in this concession area (CPFL Paulista). This is a fairly low value and does not show a significant increase in the event of a return to daylight saving time, especially when considering the simultaneous consumption and generation of solar energy from distributed generation sources.
Different load curve profiles can increase this percentage of simultaneity and make reducing consumption during peak hours more attractive, consequently generating better indicators that justify the return of daylight saving time. Therefore, each analysis must be based on the load curve profile, which is, ultimately, the crucial point that will determine whether the implementation of daylight saving time is beneficial or not.
References
The opinions and information expressed are the sole responsibility of the author and do not necessarily represent the official position of the author. Canal Solar.


Comments (1)
Comments are moderated before publication.Comments should be respectful and contribute to a healthy debate. Offensive comments may be removed. The opinions expressed here are those of the authors and do not necessarily reflect the views of the author. Canal Solar.
Dear colleague Thiago,
In fact, the MME/ONS announcement is more political than technical.
They are interested in reducing the cost of kWh, by decree and at the same time removing incentives for SFV energy.
See how they interfered at Aneel with the issue of flow inversion, almost making GD unfeasible with the recent resolutions and still not satisfied!!